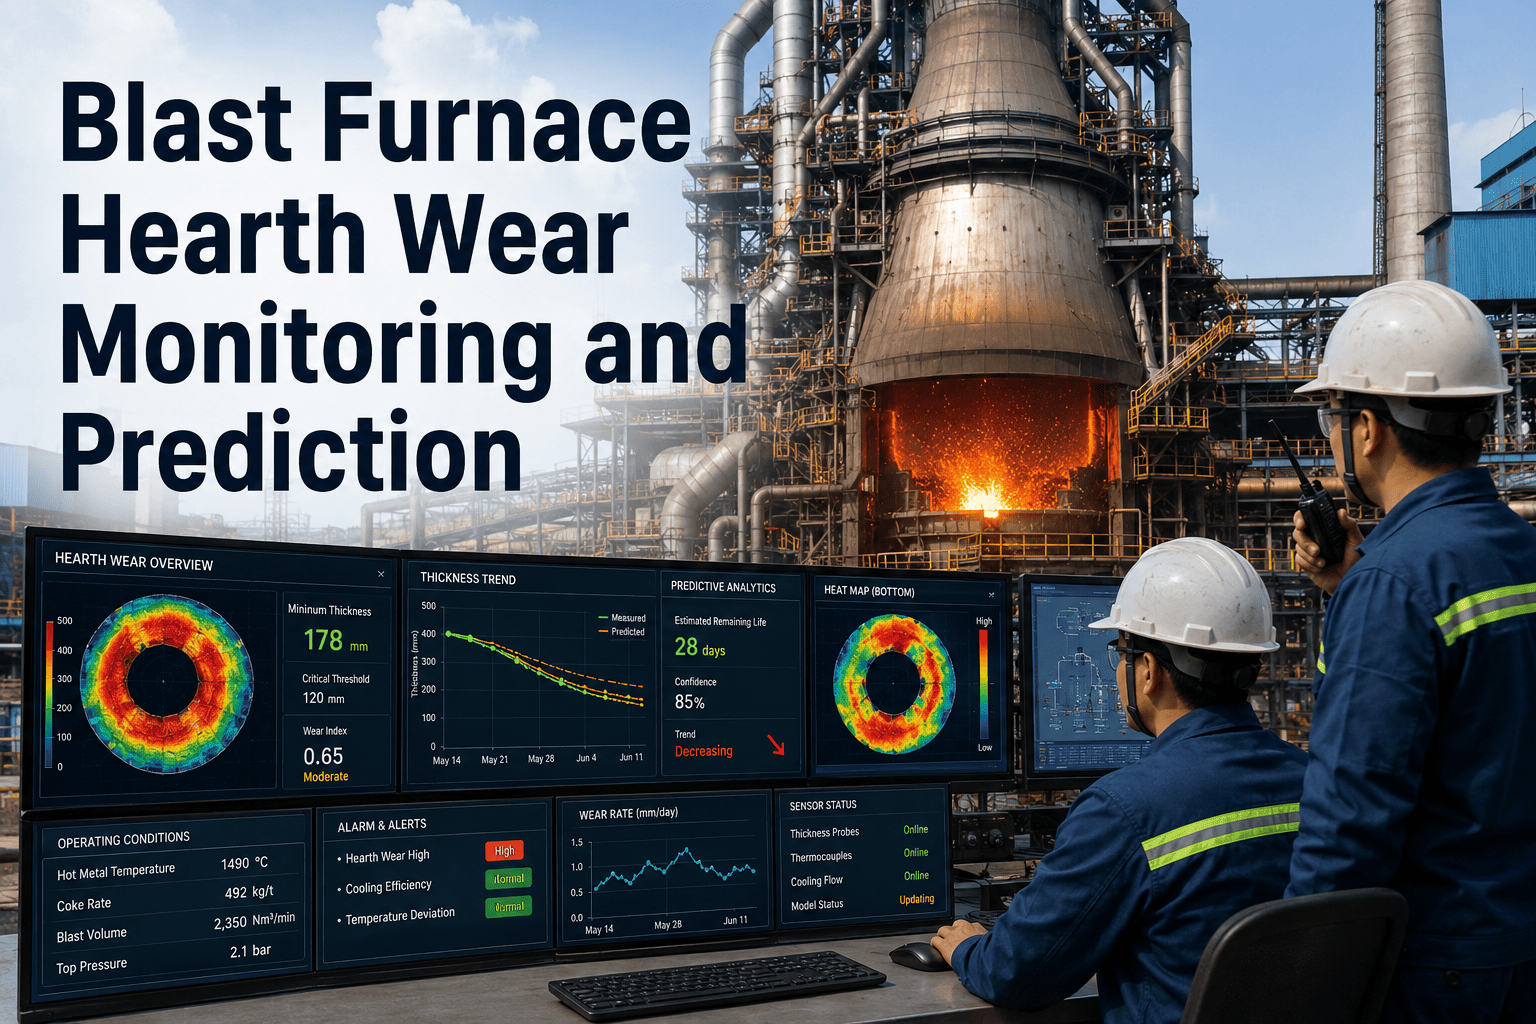
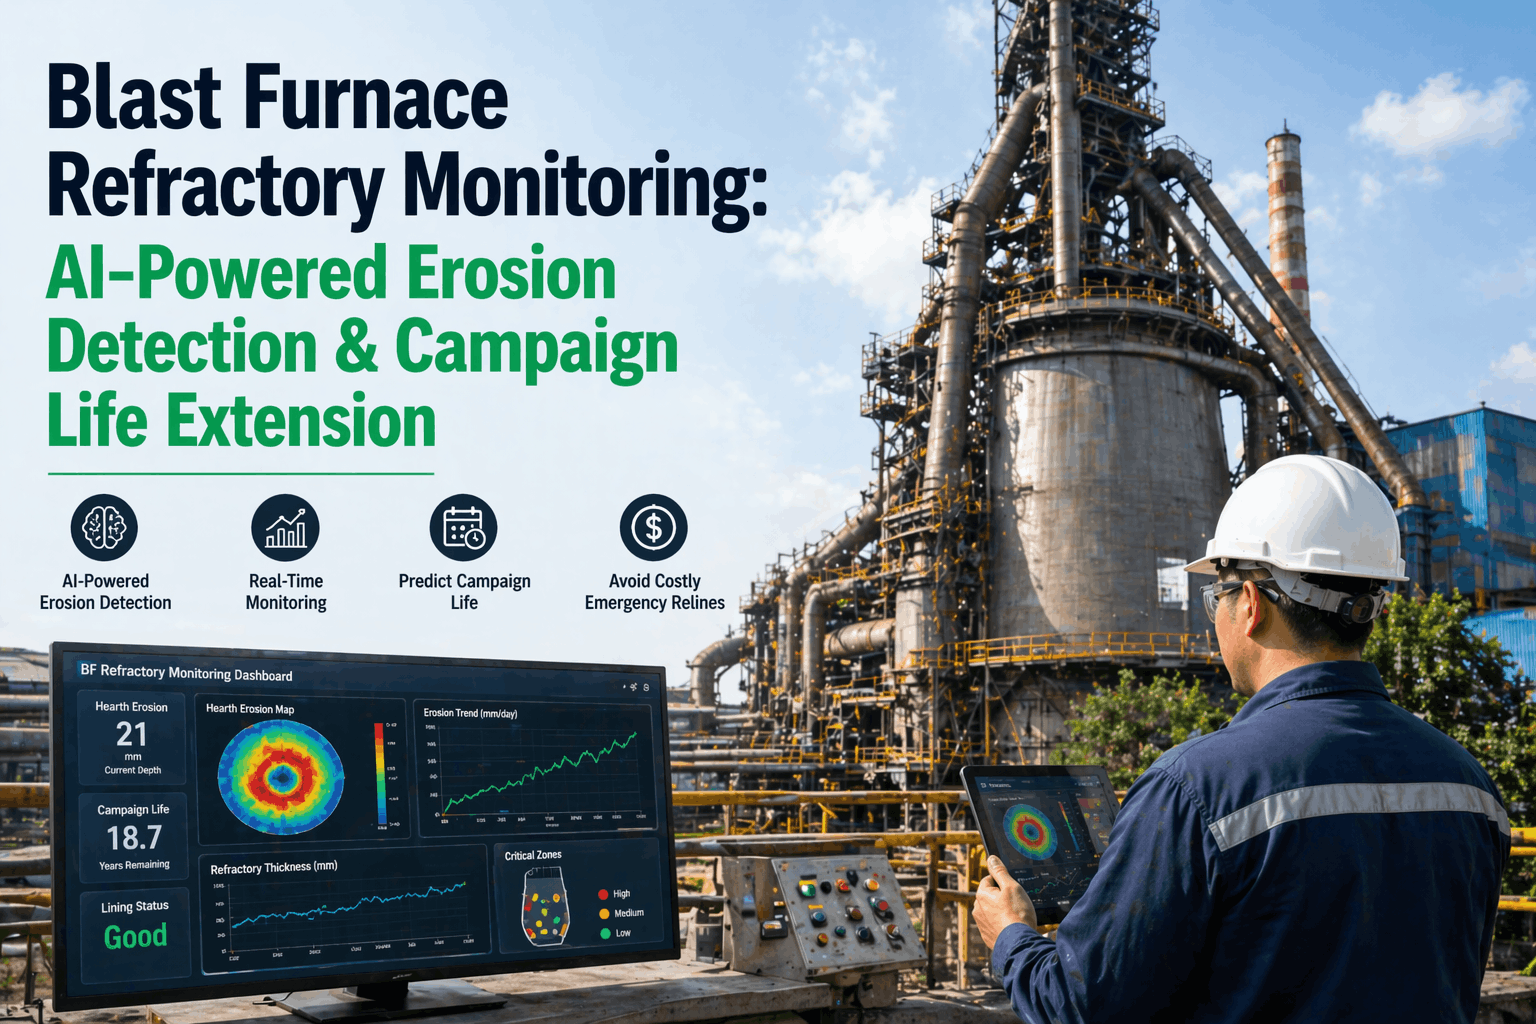
Basic oxygen furnace linings used to be judged mostly by heat count and the occasional visual inspection during a scheduled outage, which meant a shop learned about accelerated wear only after it had already happened. Laser scanning and thermal camera systems changed that by making it possible to measure lining profile after nearly every heat, but raw scan data on its own is still just a point cloud unless something turns it into an actual wear trend the operations team can act on. Our refractory monitoring specialists can show how AI turns per-heat scan data into an early warning system for your BOF campaign.
Steel Making — BOF Refractory
See Every Heat's Wear, Not Just the Outage Inspection
Laser and camera scanning already capture lining profile after nearly every heat. AI turns that raw scan data into a trend the operations team can act on before wear becomes a safety issue.
Heat 1
92% lining remaining
Heat 150
68% lining remaining
Heat 300
34% lining, trunnion zone flagged
Why Point-in-Time Scans Aren't the Same as a Wear Trend
A single laser scan tells an engineer how thick the lining is right now, but it doesn't tell them how fast that number is changing or whether the wear rate itself is accelerating. Two vessels can show the same current thickness reading while one is on a slow, predictable wear curve and the other is three heats away from crossing a critical threshold, and a raw scan comparison between them won't surface that difference without something tracking the trend across heats.
Manually reviewing scan data heat by heat across every zone of a BOF vessel is impractical for a team already managing daily operations, which is why many shops with scanning systems installed still end up relying on periodic spot checks rather than the continuous data the system is actually capable of producing.
150-400
typical heats per BOF campaign depending on practice and lining spec
Per-Heat
scan frequency possible with modern laser and camera systems
3-5
distinct wear zones typically tracked around a BOF vessel
From Point Cloud to Actionable Trend
An AI layer on top of existing scan or camera data does the comparison work a human reviewer can't keep up with heat over heat: aligning each new scan against the vessel's 3D reference profile, isolating wear by zone, and calculating a rate of change rather than just a current thickness snapshot.
1
Capture laser or thermal scan after each heat, aligned to a fixed vessel reference frame
2
Isolate wear by zone: trunnion, charge pad, tap pad, and cone separately
3
Calculate wear rate trend per zone, not just current thickness
4
Flag zones accelerating toward threshold, with a projected heats-remaining estimate
Already running laser or camera scanning on your BOF?
Book a walkthrough and we'll show what a trend layer would surface from your existing scan history.
Zones That Wear Differently, and Why That Matters
The trunnion zone, charge pad, tap pad, and cone each experience a different combination of mechanical impact and slag chemistry attack over a campaign, which is why a single vessel-average thickness number tends to hide the zone that will actually end the campaign early.
Trunnion Zone
Mechanical stress from tilting cycles concentrates wear here over a long campaign.
Charge Pad
Scrap and hot metal impact during charging causes localized mechanical erosion.
Tap Pad
Repeated tap stream exposure and thermal cycling drive erosion at the tap hole area.
Cone and Barrel
Slag line chemical attack dominates wear in the upper cone and barrel sections.
| Monitoring Approach | What It Shows | Limitation |
| Visual inspection at outage |
Condition at one fixed point in time |
No trend data between outages, wear already advanced |
| Raw laser scan review |
Thickness profile per scan |
Manual comparison across heats impractical at scale |
| AI-tracked wear trend |
Per-zone wear rate and projected remaining heats |
Requires existing scan or camera data as input |
Turning Projections Into Gunning and Repair Decisions
Once a zone's wear trend is visible, gunning and hot repair scheduling can shift from a fixed-interval routine to a targeted response, applying repair material specifically where the trend shows accelerating wear rather than spreading a fixed gunning budget evenly across zones regardless of actual condition. This targeted approach tends to both extend usable campaign life and reduce the total volume of gunning material consumed per campaign.
Earlier Warning
Zones flagged while trend is still accelerating, not after threshold is crossed.
Targeted Gunning
Repair material applied where trend data shows it's actually needed.
Planned Outages
Relining scheduled from projected remaining heats, not a fixed calendar interval.
Frequently Asked Questions
Do we need to replace our existing laser scanning system to use this?
In most cases the existing laser or thermal camera scanning hardware already installed on a BOF vessel can continue operating as-is, since the AI trend analysis works as an additional layer that processes the scan output your system already produces rather than requiring a hardware replacement. The main requirement is that scan data can be exported or accessed in a format the analysis layer can ingest, which is typically already the case for modern scanning systems from major refractory monitoring vendors.
Reach out to our team to confirm compatibility with your current scanning vendor.
How accurate is the projected heats-remaining estimate?
Projection accuracy improves as more of a campaign's wear history accumulates, since early-campaign projections have less trend data to work from than projections made in the back half of a campaign when the wear curve for that specific vessel and practice is better established. The projection is presented as a range rather than a single number precisely because wear rate can still shift if operating practice or hot metal chemistry changes mid-campaign, and the model updates its estimate continuously as new scans come in.
Book a demo to see how projection accuracy trends across a sample campaign.
Can this distinguish between normal wear and an abnormal event like a breakout precursor?
Trend-based monitoring is specifically useful for this distinction, because a sudden acceleration in wear rate at a specific zone stands out clearly against that zone's established baseline trend, in a way that's much harder to catch from a single point-in-time scan viewed in isolation. This kind of anomaly detection is one of the main reasons shops move from periodic spot-check scan reviews to continuous trend tracking, since it shortens the time between an abnormal wear event starting and someone noticing it.
Talk to our team about how anomaly alerts would be configured for your vessel.
Does this work the same way across different vessel sizes and refractory specifications?
The underlying approach of aligning scans to a fixed reference frame and tracking zone-level wear rate applies across vessel sizes, but the specific wear rate baselines are calibrated separately for each vessel and refractory specification, since larger vessels and different brick specifications wear at genuinely different rates under similar operating conditions. A shop running multiple BOF vessels with different specifications would typically see the model maintain separate baselines for each rather than applying one shop-wide standard.
Book a walkthrough to discuss your specific vessel fleet.
How is this different from the wear reports our current scanning vendor already provides?
Many existing vendor reports focus on presenting the current scan's thickness profile clearly, which is valuable but still leaves the heat-over-heat trend comparison as manual work for the engineering team. An AI trend layer specifically automates that comparison step, surfacing rate-of-change and projected remaining life per zone continuously rather than requiring someone to pull up and compare individual scan reports by hand. The two are complementary rather than competing, since the trend layer depends on the underlying scan data your current vendor's system produces.
Reach out to walk through how this would sit alongside your current reporting.
Turn Scan Data Into an Early Warning System
See the Wear Trend, Not Just the Latest Scan
Share a sample of your recent scan exports and we'll show you what a per-zone wear trend would have flagged during your current campaign.