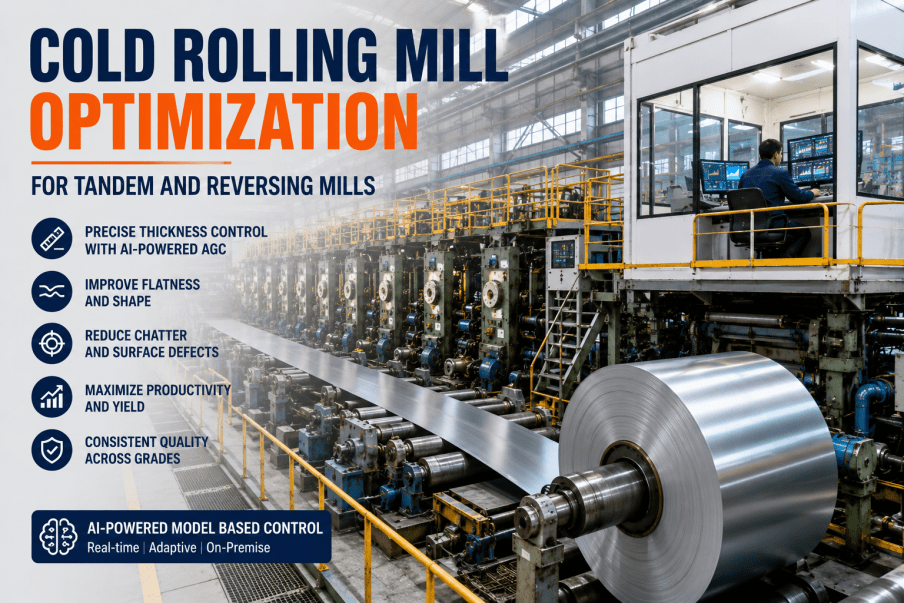
Automotive-grade cold rolled steel gives a process engineer almost no room to work with — thickness tolerances measured in microns, flatness specs tight enough that a customer's stamping die will reject a coil with visible waviness, and surface roughness that has to land in a narrow band for paint adhesion downstream. A pass schedule that looked correct in the model can still drift out of tolerance mid-coil as roll temperature climbs, tension fluctuates, or incoming hot band gauge varies slightly from what the schedule assumed. Catching that drift with SPC charts and periodic gauge readings means catching it after coils are already out of spec. AI-based control that continuously adjusts roll gap, tension, and pass allocation against a live thickness and flatness model closes that gap in real time, and it starts with a look at how your current control loop is actually performing against your tightest customer specs — worth a quick diagnostic call before your next automotive qualification run.
Four Places Thickness and Flatness Control Actually Breaks Down
Most cold mills run a well-tuned automatic gauge control loop and still see intermittent out-of-spec coils. These are the mechanisms that a standard AGC loop alone cannot fully catch.
Coils Downgraded for Thickness Deviation
Micron-level thickness drift within a coil, often tied to roll thermal expansion mid-campaign, pushes sections of a coil out of the tight tolerance band automotive customers require.
Flatness Rejects at Customer Stamping
Waviness that passes an in-house flatness gauge can still show up as a stamping problem at the customer, because in-house measurement points do not always capture every edge and center wave pattern.
Surface Roughness Out of Paint-Adhesion Band
Roll surface condition and pass schedule interact to set final strip roughness, and a schedule tuned for thickness alone can drift roughness outside the band a coating line needs.
Time to Diagnose an Intermittent Gauge Deviation
When thickness drift appears only under specific tension or speed conditions, process engineers often spend the better part of a shift correlating SPC charts before identifying the actual cause.
Recognize this pattern in your automotive-grade qualification data? Talk to an iFactory process specialist about a review of your current AGC performance against your tightest customer specs.
What the AI Control Layer Manages in Real Time
A standard automatic gauge control loop reacts to thickness deviation after it has already occurred at the measurement point. iFactory's model runs alongside your existing AGC and adds a predictive layer that adjusts roll gap, tension zones, and pass allocation ahead of drift, based on patterns learned from your mill's own roll thermal behavior, incoming hot band variation, and historical out-of-spec events.
Want to see how this model would have performed against your last automotive qualification run? Book a retrospective analysis call using your own historical gauge data.
Three Tolerance Problems the Model Catches Early
Thickness, flatness, and surface roughness interact in ways that make a single-variable control loop insufficient for the tightest automotive specs. These scenarios reflect common patterns process engineers encounter on cold mills running exposed-panel grades.
Thermal Crown Drift Mid-Campaign
As work rolls heat up over a long campaign, the roll gap that was correct at the start of the run gradually produces a thickness taper across the strip width, a drift the model anticipates and compensates for before it reaches a rejectable level.
Flatness Waves That Only Appear at Speed
Some edge wave patterns only emerge above a certain line speed as tension distribution shifts, a condition the model has learned to anticipate from historical speed-versus-flatness correlations rather than waiting for the gauge to catch it after the fact.
Roughness Drift From a Roll Change
A freshly ground roll starts a campaign with a different surface texture than a roll near the end of its cycle, and the pass schedule that produced correct roughness on the old roll may not on the new one — a gap the model flags and adjusts for automatically.
Hit Automotive-Grade Tolerances Without the Manual Rework
iFactory's control layer runs alongside your existing AGC and flatness system, adjusting roll gap, tension, and pass allocation ahead of drift instead of reacting after a coil is already out of spec.
Before and After: One Quarter on an Automotive-Grade Line
The comparison below reflects typical results from cold rolling mills producing automotive exposed and structural grades, measured over one quarter of the predictive control layer running alongside the existing AGC and flatness system.
Reactive Gauge and Flatness Control
- 91% first-time-through rate on automotive grades
- 6% coils downgraded for thickness deviation
- 5% flatness rejects at customer stamping
- 40 min average diagnostic time per gauge event
Anticipatory Gauge and Flatness Control
- 97% first-time-through rate on automotive grades
- 1.5% coils downgraded for thickness deviation
- 1.5% flatness rejects at customer stamping
- Under 5 min average diagnostic time — root cause pre-identified
Want this comparison built from your own gauge and flatness data? Book a 30-minute scoping call for a fixed-price pilot proposal.
Getting the Control Layer Live: A Practical Path
Adding a predictive control layer does not mean replacing your existing AGC or flatness system — it means giving that system a forward-looking signal it does not currently have. Most of the rollout time goes into training the model on your mill's specific thermal and tension behavior.
Control Loop Data Tap
iFactory connects to existing roll force, tension, and gauge measurement signals through a read-only tap into your Level 2 system, with no interruption to production.
Thermal and Tension Model Training
The model learns your specific roll thermal expansion behavior, tension response, and pass schedule outcomes across a representative range of grades and campaign lengths.
Shadow Mode Validation
Predicted adjustments are logged and compared against actual gauge and flatness outcomes without controlling the mill, validating accuracy before any control authority is granted.
Closed-Loop Activation
The model begins issuing real-time adjustments to roll gap, tension, and pass allocation, with process engineers reviewing performance daily during the first two weeks of live operation.
Expert Perspective
We had a good AGC system, but it was always one step behind roll thermal drift on longer campaigns, and every automotive qualification run had a few coils that fell just outside the flatness window. The predictive layer catches the drift before it becomes a deviation instead of correcting after the gauge already shows it. Our automotive first-time-through rate has not looked this good since we installed the mill.
— Process Engineer, cold rolling and finishing facility (Michigan, 900K tons/year)
first-time-through improvement on automotive grades within one quarter of go-live
reduction in flatness rejects at customer stamping operations
Stop Reacting to Gauge Deviations After They Happen
Automotive-grade tolerances leave no room for a control loop that only responds after thickness or flatness has already drifted. iFactory's predictive layer works alongside your existing AGC to catch the drift before it becomes a downgrade.
Frequently Asked Questions
Does this replace our existing AGC system?
No. The model runs alongside your existing automatic gauge control and flatness system, adding a predictive signal that anticipates drift before the standard reactive loop would catch it. Your existing control hardware and safety interlocks remain fully in place, and the predictive layer's recommendations pass through the same control architecture your team already trusts.
How does the model predict thermal crown drift before it happens?
The model is trained on your mill's own historical roll temperature, coolant flow, and thickness profile data across many campaigns, learning the specific rate at which your work rolls expand under different grade and tonnage combinations. This allows it to anticipate the thickness taper a given campaign is heading toward well before the standard gauge feedback loop would detect the deviation.
Can this help with flatness issues that only show up at the customer, not in-house?
Yes, this is one of the more common gaps the model addresses. By correlating in-house flatness gauge readings with customer-reported stamping issues over time, the model learns which flatness patterns your in-house measurement points under-report, and adjusts tension control to address those patterns proactively rather than waiting for a customer complaint to define the problem.
What data does the model need from our mill to get started?
The model trains on twelve to eighteen months of historical roll force, tension, gauge, and flatness data from your Level 2 system, along with any customer quality feedback you already track. No new instrumentation is typically required, since cold mills producing automotive grades almost always already have the sensor density needed for this level of modeling.
How long before we see measurable results on our tightest specs?
Most mills see measurable first-time-through improvement on their tightest automotive specs within the first full quarter after closed-loop activation, once the model has trained through a representative range of grades and campaign conditions. Book a scoping call to get a fixed-price proposal and timeline for your specific mill.