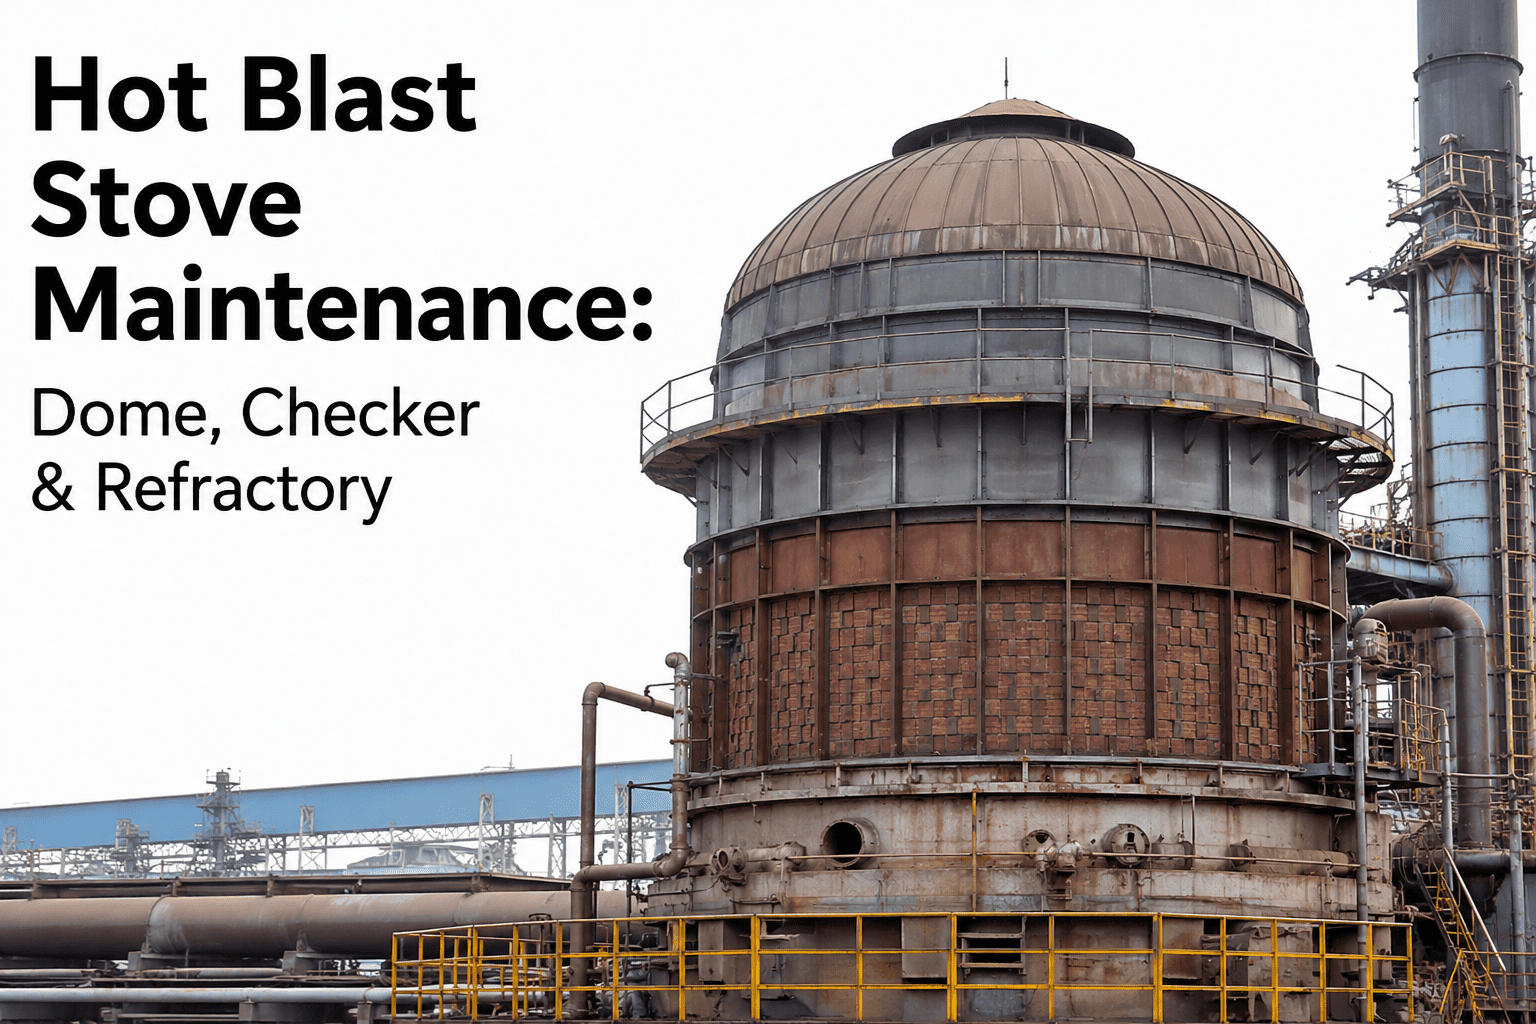
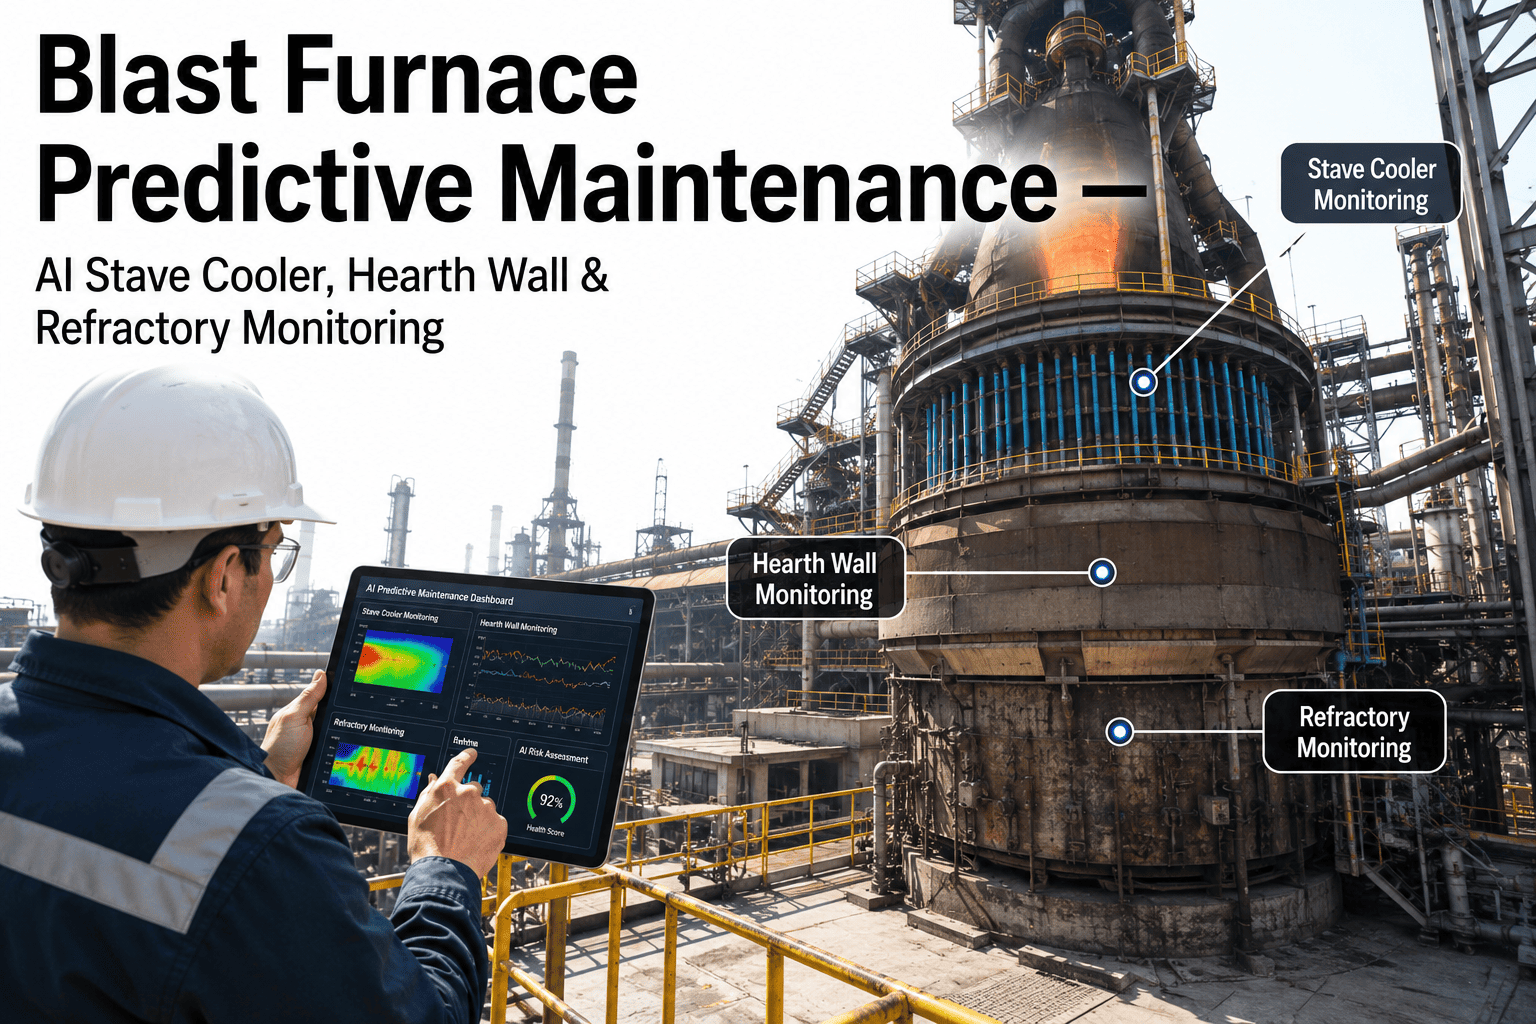
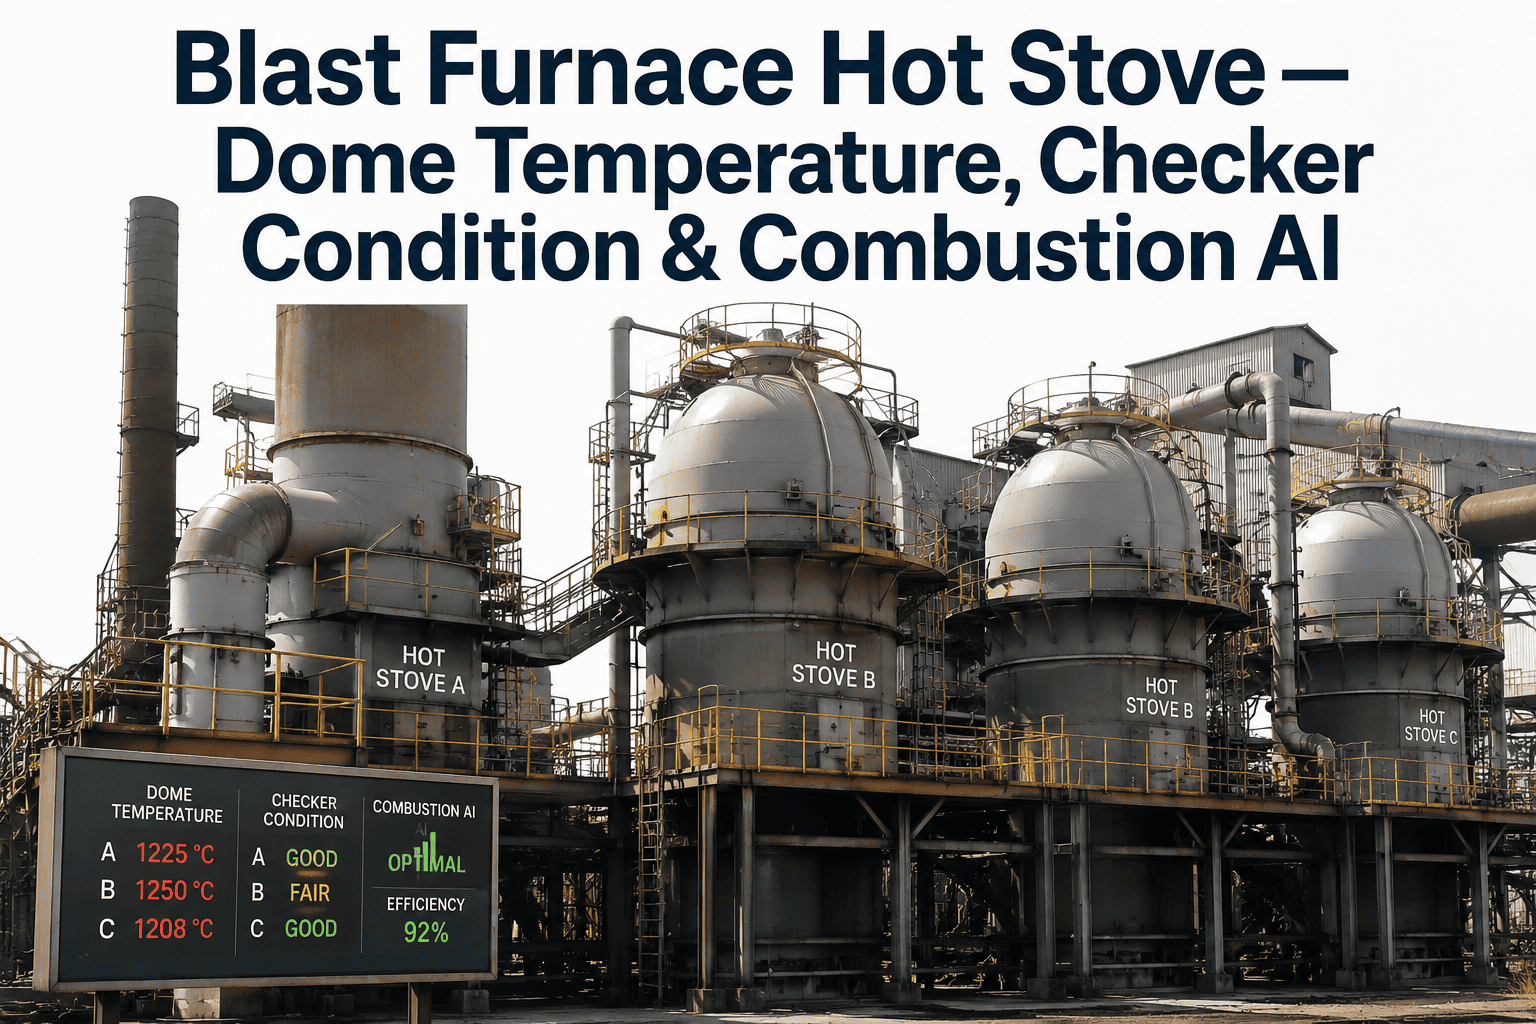
A hot blast stove that loses even fifty degrees of blast temperature forces the blast furnace to burn more coke to hold hot metal chemistry steady, and that fuel penalty compounds across every tap of every day the stove runs below its design capability. Dome cracking, checker brick channeling, and refractory spalling rarely announce themselves with a single dramatic failure; they show up first as a slow drift in blast temperature that operators often chase with combustion air changes rather than tracing back to the stove itself. iFactory connects stove instrumentation to a monitoring layer that tracks dome temperature trends, checker pressure drop, and refractory condition together, so the drift gets caught and diagnosed instead of quietly costing coke rate for months. To walk through what that monitoring looks like against your own stove data, book a demo.
BLAST FURNACE · HOT BLAST STOVES · REFRACTORY RELIABILITY
Protect Blast Temperature by Watching the Stove, Not Just the Furnace
iFactory tracks dome condition, checker brick integrity, and refractory health across every stove in the battery, turning slow degradation into an early signal your maintenance team can act on before blast temperature and coke rate pay the price.
THREE ZONES, THREE FAILURE PATHS
Where Hot Blast Stoves Actually Lose Performance
A hot blast stove is really three connected systems working together, and each one degrades in its own way, on its own timeline, for its own reasons. Treating the stove as one black box makes it hard to tell which zone is actually driving a blast temperature shortfall.
01
Combustion Dome
The dome sees the highest and most cyclic thermal load in the stove, heating and cooling with every blast-to-heat changeover, which drives fatigue cracking in the refractory lining and, over years, in the steel shell itself.
02
Checker Chamber
Stacked checker brick stores heat during the gas cycle and releases it during the blast cycle, and its performance depends entirely on maintaining even gas flow through thousands of narrow flue channels.
03
Shell and Insulation
The outer steel shell and insulating refractory layer behind the working lining protect against heat loss and structural distortion, and a breach here shows up as a hot spot on the shell long before it becomes a safety event.
Most stove performance reviews focus on blast temperature alone, which is the output of all three zones working correctly rather than a diagnostic of which one is failing. A stove instrumented to track dome refractory temperature, checker pressure drop, and shell skin temperature separately gives a maintenance team the ability to point at a specific zone instead of scheduling a full internal inspection to find out what changed.
DOME CONDITION
Reading Dome Health Before a Crack Becomes a Blow-Through
Dome refractory failure typically progresses through recognizable stages, and the earlier stages are visible in temperature and pressure data well before any visual inspection would catch a problem, since the dome is not something anyone can walk up and look at during normal operation.
Hairline Refractory Cracking
Thermal cycling opens micro-cracks in the dome refractory that show up as small, localized shell temperature increases at the affected zone, often missed without continuous point-by-point monitoring.
Progressive Crack Growth
Cracks widen with continued cycling, and hot gas begins bypassing intact refractory, producing a more pronounced and steadily rising shell temperature trend at the same location over weeks.
Localized Hot Spot
The shell temperature at the affected point rises sharply enough to be flagged by a fixed alarm threshold, at which point most operations schedule a shutdown before the condition worsens further.
Blow-Through Risk
Without intervention, continued refractory loss can progress to a shell breach, an outcome that is entirely preventable if the earlier stages were tracked and acted on rather than discovered at the alarm stage.
The value of continuous shell temperature mapping, rather than periodic thermal imaging surveys, is catching a crack in the first or second stage rather than the third. A survey conducted once a month can easily miss a crack that develops and accelerates between two survey dates, while a fixed grid of shell temperature points logged continuously narrows that blind spot to whatever the scan interval allows.
See your stove battery's dome and checker trends mapped together
iFactory pulls shell temperature, checker pressure drop, and blast temperature into one view so a drift in any zone is visible before it costs coke rate.
CHECKER BRICK INTEGRITY
Why Checker Pressure Drop Is the Number Worth Watching
Checker brick does its job by presenting a huge surface area of narrow flue channels to the gas stream, and that design is exactly what makes it vulnerable to channeling, dust accumulation, and localized collapse, all of which change the pressure drop across the checker chamber in measurable ways.
| Checker Condition |
Pressure Drop Signature |
Likely Cause |
Typical Response |
| Normal Operation |
Stable, matches design curve across blast cycle |
No action needed |
Continue routine monitoring |
| Gradual Rise |
Slow upward drift over weeks to months |
Dust and fines accumulation narrowing flue channels |
Schedule checker cleaning during next planned outage |
| Localized Drop |
Pressure drop falls below design curve |
Channeling from brick collapse opening a low-resistance path |
Internal inspection to assess collapse extent |
| Sudden Spike |
Sharp increase within a single cycle |
Acute blockage, often from a dislodged brick or slag intrusion |
Immediate investigation before next blast cycle |
Channeling is the more dangerous of the two common failure modes because it actually reduces measured pressure drop rather than increasing it, which counterintuitively can look like improved stove performance to an operator glancing at a single number without historical context. A monitoring system trending pressure drop against the stove's own historical baseline, rather than a single fixed threshold, catches this drop-based signature that a threshold-only alarm would miss entirely.
REFRACTORY MANAGEMENT
Building a Refractory Life Cycle Instead of Reacting to Failures
Refractory in a hot blast stove does not fail on a fixed calendar schedule, it fails according to accumulated thermal cycles, chemical attack from blast furnace gas constituents, and mechanical stress from combustion pressure swings, which means a life cycle approach based on actual condition data outperforms a fixed replacement interval in both cost and reliability.
Baseline Condition Survey
A thorough internal inspection at a planned outage establishes the starting condition of dome, checker, and shell refractory across every accessible zone, creating the reference point every future trend gets measured against.
Continuous Condition Trending
Shell temperature mapping and checker pressure drop tracked between outages extend the baseline survey into an ongoing picture of degradation rate, rather than a snapshot that goes stale the moment the outage ends.
Targeted Repair Planning
Trend data pinpoints which zones need attention at the next outage, letting refractory repair crews focus effort and material where degradation is actually concentrated instead of resurfacing the entire lining out of caution.
Remaining Life Estimation
Comparing current degradation rate against the baseline survey and known refractory specifications produces a realistic remaining-life estimate that supports outage planning years in advance rather than reacting to a crisis.
THE COKE RATE CONNECTION
What a Degraded Stove Actually Costs in Fuel
Blast temperature and coke rate are directly linked through basic furnace thermodynamics, and a stove battery running below its design blast temperature forces the furnace to make up that heat deficit with additional coke, a cost that accumulates silently because nobody schedules a shutdown over fifty degrees of blast temperature.
DOME DEGRADATION
Refractory loss increases heat loss through the dome, reducing the peak temperature the stove can achieve and hold during the blast cycle.
CHECKER CHANNELING
Gas bypassing collapsed checker sections reduces effective heat transfer area, lowering the average blast temperature the stove can deliver across a full cycle.
SHELL HEAT LOSS
Insulation breakdown behind the working lining bleeds heat to atmosphere continuously, a loss that compounds across every hour the stove operates.
The practical implication is that stove condition monitoring pays for itself primarily through fuel savings that show up in the furnace's coke rate ledger, not just through avoided emergency repairs. A battery of stoves running consistently near design blast temperature, verified through condition data rather than assumed from a working schedule, is one of the more reliable levers available for holding coke rate steady over a multi-year campaign.
DEPLOYMENT
How iFactory Builds a Stove Monitoring Program
iFactory works with your existing shell temperature sensors, pressure transmitters, and combustion instrumentation, adding the analytics layer that turns raw readings into zone-level condition trends your refractory and process teams can plan against.
What Gets Built
Shell temperature grid mapping across dome, checker, and shell zones
Checker pressure drop trending against historical baseline
Blast temperature correlation with coke rate by stove
Early-stage crack and channeling alerting
Outage planning support with remaining-life estimates
Rollout Timeline
Weeks 1–3: Instrumentation audit and data integration across the stove battery
Weeks 4–7: Baseline trend capture and threshold calibration by zone
Weeks 8–10: Dashboard go-live, alerting, and refractory team training
FREQUENTLY ASKED QUESTIONS
What Steel Plant Teams Ask About Stove Monitoring
Do we need new sensors, or can this work with our existing stove instrumentation?
Most stove batteries already carry shell temperature points and pressure transmitters that were installed at commissioning, and iFactory's monitoring layer typically connects to that existing instrumentation rather than requiring a full re-instrumentation project. Where coverage gaps exist, such as missing shell temperature points at zones with a history of refractory issues, we identify those during the initial audit so targeted additions can close the gap without an oversized sensor project.
Book a demo to review your current instrumentation coverage.
How early can this actually catch dome cracking before it becomes a real problem?
Continuous shell temperature trending can flag the earliest measurable stage of dome refractory degradation, the small localized temperature rise that precedes visible cracking, often weeks to months before the condition would trigger a fixed alarm threshold or become visible during a routine thermal survey. The exact lead time depends on your stove's refractory type and cycling frequency, which is part of what the baseline trend capture period establishes for your specific battery.
Contact our support team to discuss expected lead times for your stoves.
Can this help us tell the difference between checker channeling and normal dust buildup?
Yes, and this distinction matters because the two conditions call for very different responses: dust buildup raises pressure drop gradually and is addressed with cleaning at a planned outage, while channeling from brick collapse lowers pressure drop and calls for an internal inspection to assess structural damage. Trending pressure drop against your stove's own historical baseline, rather than a single threshold, is what makes this distinction visible instead of both conditions looking like undefined noise.
Book a demo to see this pattern against your own checker data.
How does stove condition data actually connect to our coke rate reporting?
Blast temperature is one of the direct inputs to coke rate calculation, so correlating each stove's actual delivered blast temperature against its condition trend gives process engineers a fuel-cost dimension to add to what has traditionally been treated as a purely mechanical maintenance question. This connection is what turns a stove refractory discussion from a maintenance budget line into a fuel efficiency conversation that plant management already tracks closely.
Contact our support team to discuss coke rate correlation reporting for your battery.
What's a realistic timeline before we see useful trend data from a new stove monitoring setup?
Meaningful baseline trends typically emerge within four to seven weeks of data collection, since that window generally captures enough blast and gas cycles across your specific stoves to distinguish normal cyclic variation from a genuine degradation trend. The full rollout to a trained, alerting-enabled dashboard usually completes within about ten weeks, though early condition signals often surface well before that milestone once a few weeks of consistent data have accumulated.
Book a demo to set expectations against your stove battery's cycle frequency.
PROTECT BLAST TEMPERATURE, PROTECT COKE RATE
Turn Stove Condition Into a Number Your Team Can Plan Against
iFactory connects dome, checker, and shell instrumentation into one condition picture so refractory degradation is caught early and coke rate stays where it belongs.