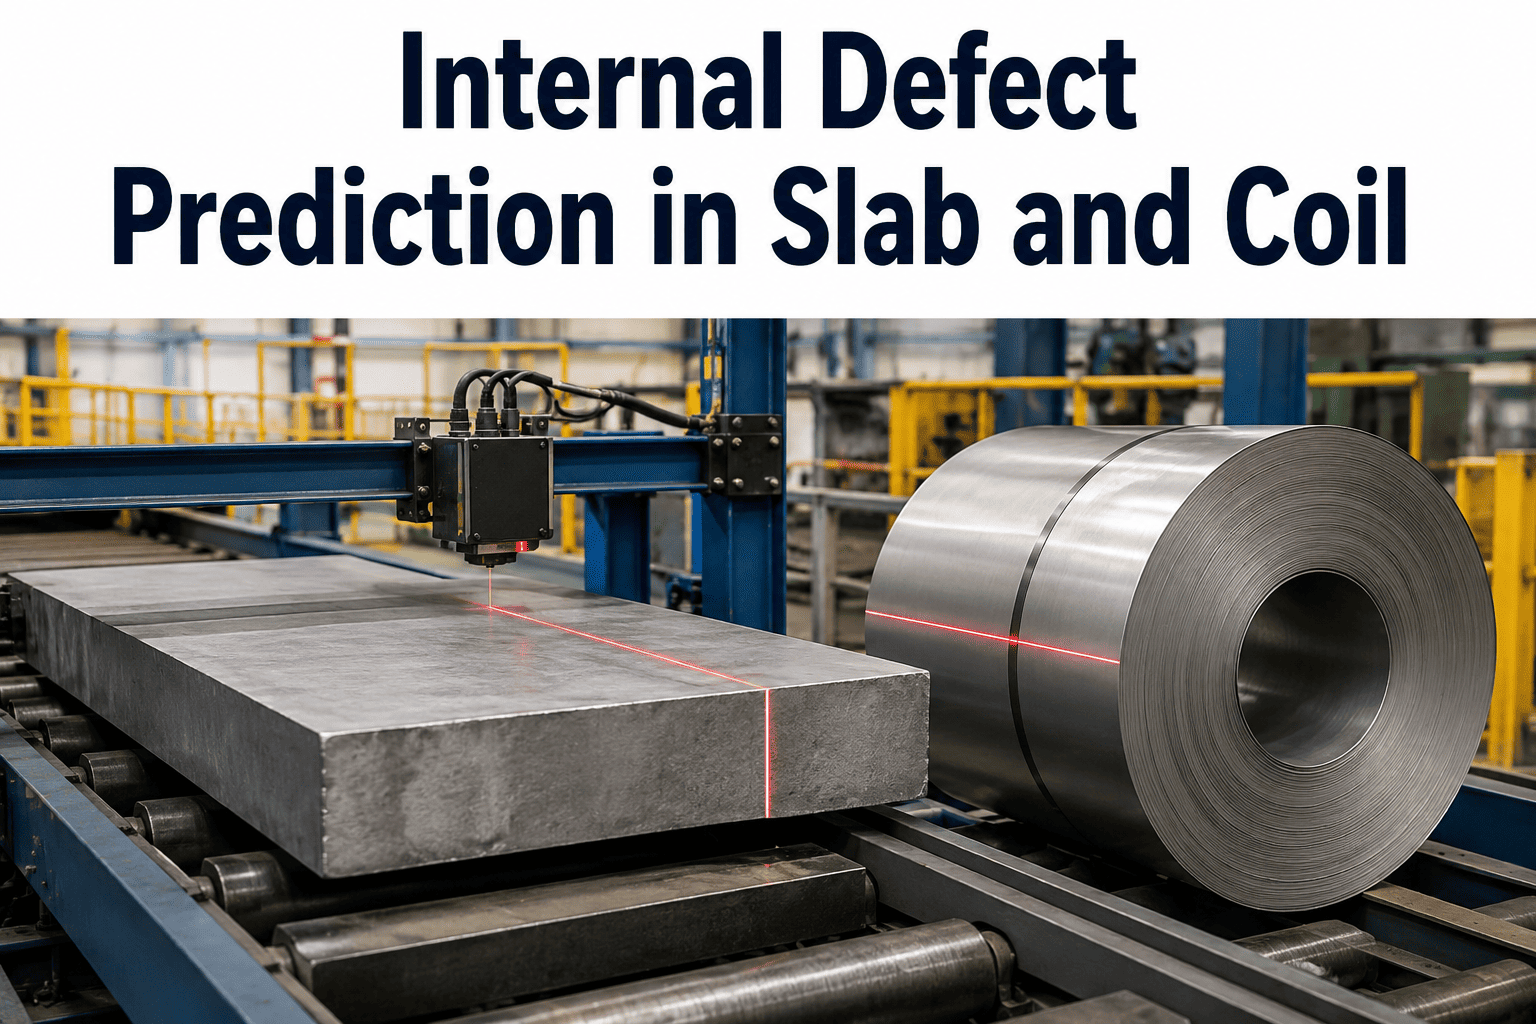
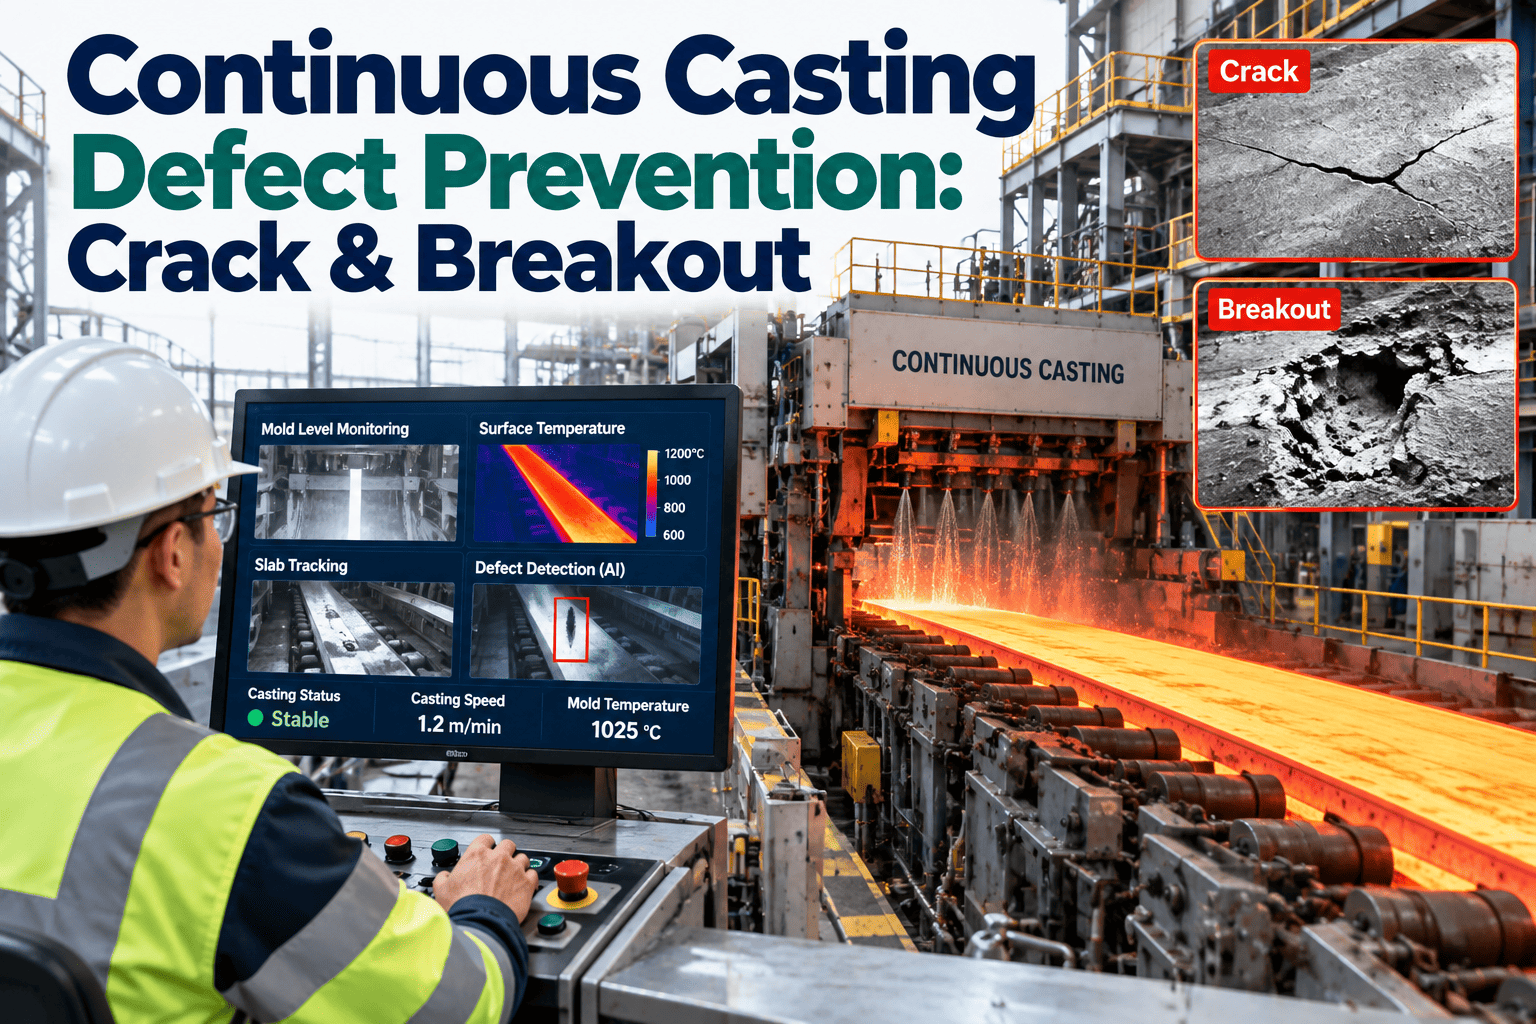
Internal defects like centerline segregation, non-metallic inclusions, and hot tears rarely announce themselves at the caster or hot mill. They pass every surface inspection cleanly and travel downstream to a customer's rolling or forming operation, where they finally show up as a cracked part or a failed bend test, at which point the cost of the defect has multiplied several times over and the relationship with that customer has taken a hit. Our quality engineering team can walk through how AI-based internal defect risk scoring works against your own casting and rolling process data.
Quality & Defect Prediction
Catch Internal Defects Before the Customer Does
Segregation, inclusions, and hot tears don't show up on a surface inspection. An AI model scores internal defect risk per slab from the casting and rolling data you already collect, before the product ships.
Slab Risk Heatmap
One slab per shift flagged high risk before it left the caster
Why Internal Defects Slip Past Every Inspection Point
Surface inspection systems, whether visual, eddy current, or laser-based, are built to catch conditions visible or detectable at the product surface. Centerline segregation, internal porosity, non-metallic inclusions, and hot tears form inside the slab or billet during solidification and rolling, and by definition don't present a surface signature until a downstream process, like cold rolling or forming at the customer's plant, opens them up.
That means the first real indication of an internal defect is often a customer complaint or a failed mechanical test well after the material has shipped, at which point the cost includes not just the scrapped material but also claims processing, potential line stoppage at the customer's facility, and the reputational cost of a quality escape that reached an external customer.
Invisible
to standard surface inspection systems by definition
10-50x
typical cost multiplier when a defect is caught downstream versus at the caster
4
major internal defect categories process data can help predict
What Process Data Already Signals Internal Defect Risk
Internal defect formation correlates with process conditions that are already being logged during casting and rolling, even though those correlations aren't always obvious from a single variable viewed in isolation. A model trained on historical defect findings against corresponding process data learns which combinations of conditions elevate risk for each defect type.
Centerline Segregation
Correlates with casting speed, superheat, and secondary cooling profile during solidification.
Non-Metallic Inclusions
Linked to ladle practice, tundish residence time, and mold flux behavior during casting.
Hot Tears
Associated with thermal gradient severity and mechanical stress during solidification and straightening.
Internal Porosity
Tied to feeding conditions and cooling rate in the final stages of solidification at the slab center.
Want to see what your own casting data already signals about internal defect risk?
Book a walkthrough and we'll review a sample of recent heats against known defect findings.
From Risk Score to a Routing Decision
Rather than treating every slab identically after casting, a risk-scoring model flags the subset that shows an elevated probability of a specific internal defect type based on how its casting parameters compare to the historical pattern associated with confirmed defects. That flag becomes a routing input: a high-risk slab can be directed toward additional non-destructive testing, held for ultrasonic inspection, or routed to a less demanding end-use application rather than shipped toward a customer application where the defect risk carries the highest consequence.
1
Casting and rolling process data captured per slab as it's produced
2
Model scores risk by defect type against historical confirmed-defect patterns
3
High-risk slabs flagged for targeted NDT or inspection before shipment
4
Confirmed findings feed back into the model, refining future risk scores
| Risk Level | Typical Signal | Recommended Action |
| Low |
Process parameters within normal historical range |
Standard inspection and shipment routing |
| Elevated |
One or more parameters trending toward known risk pattern |
Additional targeted spot inspection before ship |
| High |
Combination of parameters closely matches confirmed-defect history |
Full NDT hold or reroute to lower-risk application |
What This Changes in the Claims Conversation
Beyond preventing individual defect escapes, a working risk model changes how a quality team can talk about internal defect performance with customers, since it becomes possible to point to a systematic screening process applied before shipment rather than relying entirely on statistical sampling. This tends to matter most for customers in demanding end-use applications like automotive body panels or pressure vessel components, where an internal defect escape carries outsized downstream consequences relative to the material cost itself.
Fewer Escapes
High-risk material caught before it reaches a demanding customer application.
Targeted NDT
Inspection resources focused on flagged material instead of blanket sampling.
Stronger Claims Position
Systematic screening process to point to in customer quality conversations.
Frequently Asked Questions
What historical data is needed to train an internal defect risk model?
A useful starting model needs a set of confirmed internal defect findings, whether from customer claims, internal NDT results, or downstream processing feedback, matched against the casting and rolling process data recorded for those specific slabs or coils. The more confirmed findings available across a range of defect types and severities, the more reliable the resulting risk scores, so shops with a longer history of documented defect findings and corresponding process data typically see faster initial accuracy.
Reach out to our team to review what historical defect and process data you already have available.
Does this replace ultrasonic testing or other NDT methods?
Risk scoring is designed to work alongside existing NDT methods rather than replace them, since the model's output is a probability estimate based on process data correlation, not a direct physical measurement of whether a defect actually exists in a specific slab. What changes is how NDT resources get allocated, since instead of applying a fixed sampling rate across all production, testing capacity can be weighted toward the material the model flags as higher risk, which tends to catch more actual defects for the same amount of testing effort.
Book a demo to see how this would integrate with your current NDT program.
How accurate is the risk score, and what happens with false positives?
Risk scoring accuracy improves as more confirmed findings accumulate and validate the model's predictions, but no process-data-based model achieves perfect accuracy, so some flagged material will pass inspection without an actual defect present. This tradeoff is generally accepted because the cost of an unnecessary spot inspection is far lower than the cost of a defect escape reaching a customer, and the model's threshold for flagging material can be tuned based on how conservative a given shop wants to be for a specific product line.
Talk to our team about how flagging thresholds get calibrated to your risk tolerance.
Can this be applied separately to different steel grades or end-use applications?
Different grades and applications generally warrant different risk models, since the process parameters that correlate with internal defects, and the consequence severity of a given defect type, both vary by grade and end use. A shop serving both general commercial applications and demanding automotive or pressure vessel customers would typically see tighter risk thresholds and more conservative flagging applied to the material destined for the higher-consequence applications.
Book a walkthrough to discuss risk modeling across your specific product portfolio.
How long does it take to see a measurable reduction in customer defect claims?
Initial risk flagging can begin as soon as a baseline model is trained on available historical data, but a measurable reduction in customer-reported defect claims typically takes several production cycles to become statistically visible, since claims volume on well-run lines is already relatively low and needs enough data to distinguish a real trend from normal variation. Internal metrics, like the rate of flagged material confirmed as defective through targeted NDT, tend to show model value earlier than external claims data does.
Reach out to discuss realistic timelines based on your current claims volume and process data maturity.
Stop Learning About Defects From the Customer
Score Internal Defect Risk Before Material Ships
Share your recent defect findings and casting process data and we'll show you what a risk model would have flagged before shipment.