A 300-tonne steel ladle cycles from ambient temperature to 1,650 degrees and back every four to six hours, and reliability engineers managing a fleet of 12 to 24 of these vessels are essentially running a rolling safety and cost equation with no room for guesswork. When heat counts are estimated rather than tracked per zone, refractory overconsumption climbs to 2 to 4 kilograms per tonne of steel, slide gate and well block wear becomes unpredictable, and the worst-case outcome, a molten steel breakout, moves from unlikely to a matter of time. Fleet-wide digital tracking of heats per zone, slide gate reliability, and turret condition changes that equation entirely, with plants reporting a 25 percent reduction in unplanned ladle breakouts within twelve months of implementation. Reliability engineers ready to map their own fleet against this benchmark can book a demo and see live ladle condition scoring across a full turret rotation.
LADLE FLEET INTELLIGENCE · REFRACTORY & SLIDE GATE · 2026
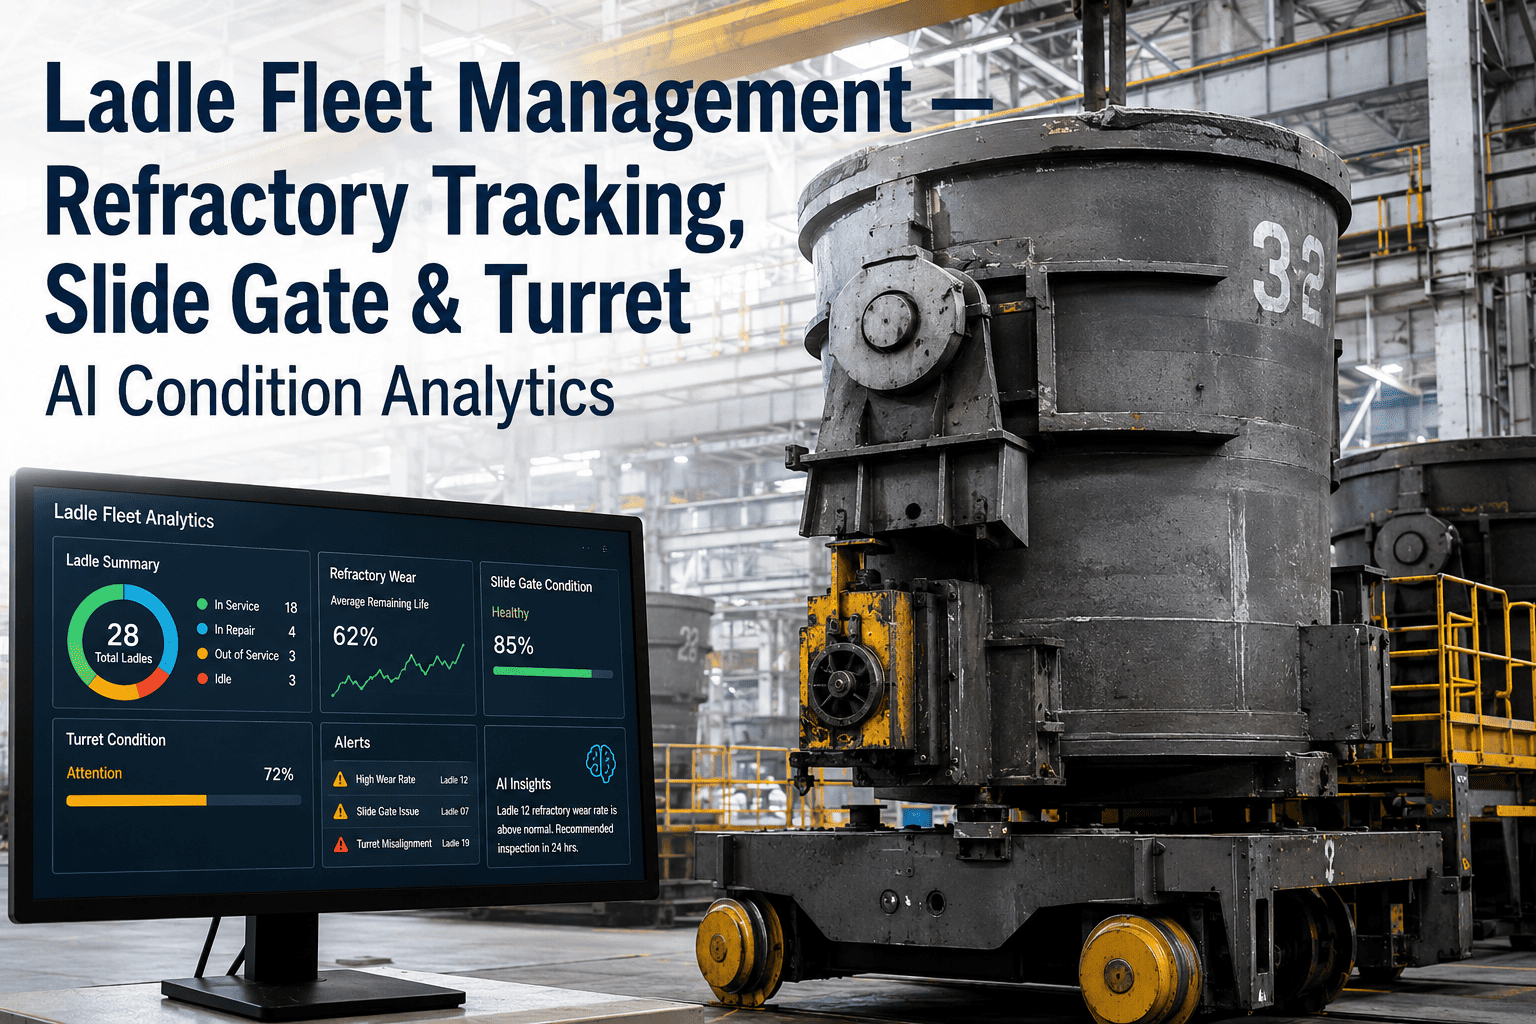
Every Ladle, Every Zone, Every Heat, Tracked
Replace estimated heat counts with per-zone refractory wear data, slide gate reliability scoring, and turret condition analytics across your entire fleet.
What Untracked Ladle Fleets Actually Cost
2-4x
Refractory overconsumption in kg per tonne when heat counts are estimated instead of tracked per zone
$15-30K
Cost of a single unplanned reline triggered by an untracked slide gate or well block failure
57
Recognized root causes of argon plug breakout failures alone, most of them preventable with proper tracking
25%
Reduction in unplanned ladle breakouts within the first 12 months of digital fleet tracking
The Ladle Circulation Cycle Reliability Engineers Manage
Every ladle in the fleet moves through the same cycle dozens of times a week, and each stage carries its own wear pattern that needs to be logged against the vessel, not against a shift log.
Stage 1
Fill at BOF or EAF
High-momentum molten steel stream strikes the impact pad, driving the fastest erosion rate of any zone in the vessel.
Stage 2
Secondary Metallurgy
Argon stirring through porous plugs continues chemical attack on the slag line, the zone that most often limits campaign length.
Stage 3
Transport to Caster
Slide gate and well block integrity become critical here, since gate failure during casting is a safety-critical event.
Stage 4
Empty & Turnaround
Skull removal and visual inspection are the only checkpoint most plants rely on, missing subsurface wear entirely.
RELIABILITY ENGINEERING · LADLE FLEET
Digitize the Gap Between Turret and Reline
See how per-zone heat tracking would have flagged your last unplanned reline weeks before it happened.
Component Wear Benchmarks Across a Ladle Campaign
| Component | Typical Replacement Interval | Failure Consequence |
| Well Block & Seating Block |
Every 40-60 heats |
Critical to slide gate operation, high breakout risk if missed |
| Porous / Stir Plugs |
Every 10-20 uses |
Uneven argon stir, secondary metallurgy quality loss |
| Working Lining (Barrel) |
150-225mm thickness, ≤0.5mm erosion/heat |
Structural thinning, shell hotspots |
| Slag Line Refractory |
Campaign-limiting zone |
Fastest wear zone, most common driver of full reline |
Tracked Fleet vs Untracked Fleet: The Risk Escalation
Digitally Tracked Fleet
Heats tracked per zone, thermal imaging active
Reline scheduled proactively before critical thickness
Plant uptime near 98.6 percent in documented case studies
Untracked Fleet
Heat counts estimated, residual thickness unknown
Emergency repairs become frequent and costly
Breakout risk of 20 to 400 tonnes of molten steel escaping
Turret and Circulation Analytics
Ladle turrets rotate vessels between tapping and casting positions dozens of times a day, and turret condition is just as capable of stalling a heat sequence as a refractory failure inside the ladle itself.
Bearing & Rotation Health
Vibration trending on turret bearings flags mechanical wear before rotation delays start affecting cast sequencing.
Arm Load Balance
Uneven load distribution across turret arms accelerates fatigue on the heavier-loaded side, shortening turret service life.
Positioning Accuracy
Drift in rotation stop position increases alignment risk during ladle-to-tundish transfer, a safety-relevant metric.
Fleet Sizing Benchmarks by Melt Shop Scale
Reliability Engineers Ask
How does per-zone tracking actually reduce breakout risk?
Per-zone tracking replaces a single fleet-wide estimate with individual wear data for the impact pad, slag line, barrel, and bottom of every ladle, since each zone erodes at a fundamentally different rate. This lets reliability engineers schedule reline or repair based on the zone that is actually approaching critical thickness rather than a conservative average that either wastes campaign life or misses the real risk. Plants using this approach report a 25 percent reduction in unplanned breakouts within the first year.
What data do we need to start tracking a 12 to 24 ladle fleet?
The starting dataset is simpler than most teams expect: each ladle's unique lining blueprint, installation date, heats accumulated since last reline, and any existing thermal imaging or shell temperature readings already being collected. From there, the platform builds a wear model per zone and starts flagging components like well blocks and porous plugs that are approaching their typical replacement interval. Teams can check what data they already have available through
support before starting a rollout.
How much does an unplanned ladle breakout actually cost?
A molten steel breakout can release anywhere from 20 to 400 tonnes of steel depending on ladle size and the stage of failure, resulting in equipment destruction and a production shutdown that can run for days, on top of the direct safety risk to personnel. Even short of a full breakout, an unplanned reline driven by an untracked slide gate or well block failure typically costs $15,000 to $30,000 and forces schedule disruption across the whole ladle rotation. Reliability teams can
book a demo to model this cost against their own fleet size.
Does this replace our existing visual inspection process?
No, visual inspection during turnaround remains an important checkpoint, but it only catches surface-level skull buildup and visible cracking, missing the subsurface erosion that drives most breakout risk. Digital tracking adds the layer that visual inspection cannot provide: continuous heat-count accumulation per zone, thermal imaging trend data, and predictive wear modeling that flags a ladle before it reaches an unsafe condition. The two approaches work together rather than one replacing the other.
How quickly can we expect to see fewer unplanned relines?
Most fleets see measurable improvement in reline predictability within the first full campaign cycle, since the model needs a baseline of tracked heats per zone before its predictions reach full accuracy. Early wins typically come from catching well block and porous plug wear that was previously running past the recommended interval, since those components have the shortest and most predictable replacement cycles in the fleet.
LADLE FLEET · REFRACTORY · SLIDE GATE · TURRET
Stop Estimating. Start Tracking Every Heat.
Join reliability teams already cutting unplanned ladle breakouts by 25 percent with fleet-wide digital tracking.