Every fault inside a rolling mill gearbox leaves a fingerprint in the vibration spectrum long before it leaves a mark anyone can see or hear. A worn outer race bearing, a cracked gear tooth and a misaligned shaft each vibrate at a different, calculable frequency, and reading that spectrum correctly is the difference between naming the fault weeks early and discovering it mid-campaign. Most plants still read only the overall vibration number, which hides exactly the detail that matters. Reliability teams who want to see their own gearbox spectrum decoded can walk through a signature analysis on real mill data with our team.
Decode What the Spectrum Is Already Telling You
iFactory, an on-premise AI platform for predictive maintenance, matches every peak in a gearbox vibration spectrum against known bearing, gear and shaft fault signatures, and attaches a confidence score to each finding.
What Is a Vibration Signature, and Why Does Each Fault Have Its Own?
A vibration signature is the specific frequency, or set of frequencies, that a particular mechanical fault produces relative to shaft running speed. Unbalance always shows up near 1x running speed, a bearing outer race defect always shows up at a frequency set by that bearing's own geometry, and a gear tooth fault always shows up near the gear mesh frequency. Ask our team which signatures apply to your specific gearbox and bearing catalog before you start reading spectra by eye.
Fault Type, Frequency Signature and What It Confirms
| Fault type | Frequency signature | Confirming indicator |
|---|---|---|
| Unbalance | 1x running speed | Single clean peak, radial, grows with load |
| Misalignment | 1x and 2x running speed | Strong axial component alongside the radial peak |
| Looseness | 1x, 2x, 3x, 4x harmonics | Rising harmonic series with an elevated noise floor |
| Outer race bearing (BPFO) | Non-synchronous, geometry-based | Envelope analysis confirms the impact pulse |
| Inner race bearing (BPFI) | Non-synchronous, geometry-based | Sidebands spaced at 1x on either side of BPFI |
| Gear tooth fault (GMF) | Tooth count multiplied by running speed | Sidebands spaced at shaft speed around GMF |
| Journal bearing oil whirl | 0.5x running speed | Subharmonic peak, usually low-speed shafts |
Where BPFO and BPFI Actually Come From
Bearing fault frequencies are not arbitrary — they are calculated directly from a bearing's own geometry: ball count, ball diameter, pitch diameter and contact angle.
For a typical bearing with nine rolling elements, BPFO works out to roughly 3.5 to 4 times shaft speed and BPFI to roughly 5 to 6 times — but the exact multiplier always depends on that bearing's own catalog data, never a generic rule of thumb.
See These Signatures on Your Own Gearbox Spectrum
Share a recent vibration reading from one mill drive gearbox and we will walk through what each peak is actually telling you.
How Severe Is It? The ISO 20816 Zone Scale
Naming the fault is only half the picture — ISO 20816-9 gives gear units a shared severity scale from Zone A to Zone D, so a reading means the same thing across different gearboxes and mills.
How AI Turns a Spectrum Into a Named Finding
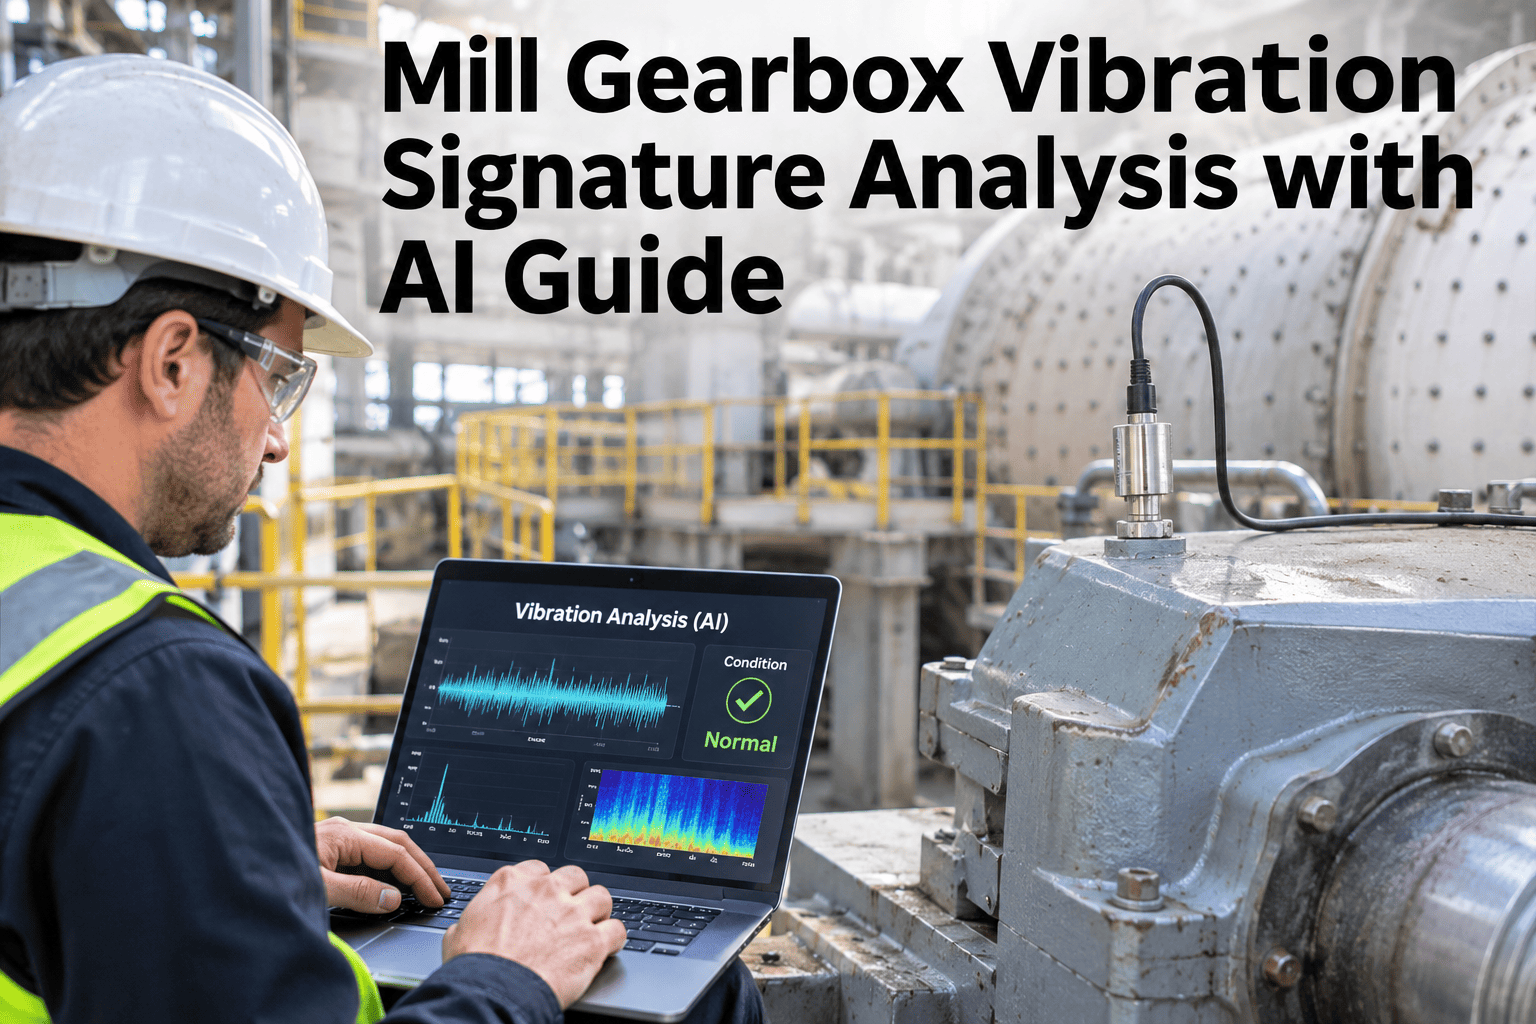
Reading a spectrum by eye takes an experienced analyst and still leaves room for disagreement. An AI pipeline applies the same signature logic consistently, on every reading, from every gearbox.
An accelerometer logs raw vibration at the bearing housing and gear mesh point.
FFT converts the signal into a frequency spectrum against shaft running speed.
Envelope analysis isolates bearing impact frequencies hidden under larger vibration.
Peaks are matched against this specific gearbox and bearing's known fault frequencies.
A confidence score is attached and a work order is opened for a confirmed finding.
Sidebands That Showed Up Three Weeks Before a Tooth Fracture
A mill drive gearbox's gear mesh frequency began showing a small but steady pair of sidebands spaced at shaft speed, while overall vibration stayed well inside Zone B the entire time. The illustrative figures below show how the finding developed.
Signature Analysis Without Needing an Analyst on Every Reading
Per-Asset Fault Library
BPFO, BPFI, BSF, FTF and GMF calculated and held for each gearbox and bearing on your asset register.
Envelope & Order Analysis
Both bearing and gear fault signatures are checked on every reading, not only overall severity.
ISO 20816 Zone Scoring
Severity is checked against the correct zone class for each asset, alongside the named fault.
Turnkey On-Premise Deployment
Spectrum data and fault libraries stay on your own server, with no outside cloud dependency.
What Reliability Teams Ask About Gearbox Vibration Signatures
What is the difference between overall vibration and a vibration signature?
Overall vibration is a single number summarizing total energy, while a signature is the specific frequency pattern a particular fault produces, which is what actually names the problem. See the difference on your own spectrum in a short session.
Why do I need to know my bearing's exact geometry for BPFO and BPFI?
Bearing fault frequencies are calculated from ball count, ball diameter, pitch diameter and contact angle, so a generic multiplier from a different bearing model will point an analysis at the wrong frequency. Ask support about building your bearing fault library for your asset register.
What is envelope analysis, and why is it called the gold standard for bearings?
Envelope analysis demodulates the signal to isolate the small, high-frequency impacts a bearing defect produces, which raw FFT often hides under larger low-frequency vibration from the rest of the gearbox. Walk through envelope analysis on a sample reading.
Can a gearbox fail even if it is in ISO 20816 Zone A or B?
Yes. Gear mesh sidebands and bearing envelope signatures can be clearly developing while overall severity is still comfortably inside an acceptable zone, which is exactly why signature analysis matters alongside the zone score. Discuss how to catch early findings that zone scoring alone would miss.
How does AI decide a signature match is confident enough to act on?
The system compares the peak location and sideband pattern against the asset's own calculated fault frequencies and trend history, and attaches a confidence score rather than a simple pass or fail. See how confidence scoring works on your own gearbox data.
Stop Reading Overall Vibration and Start Reading the Signature
See bearing, gear and shaft fault signatures matched automatically on your own rolling mill gearbox spectrum.