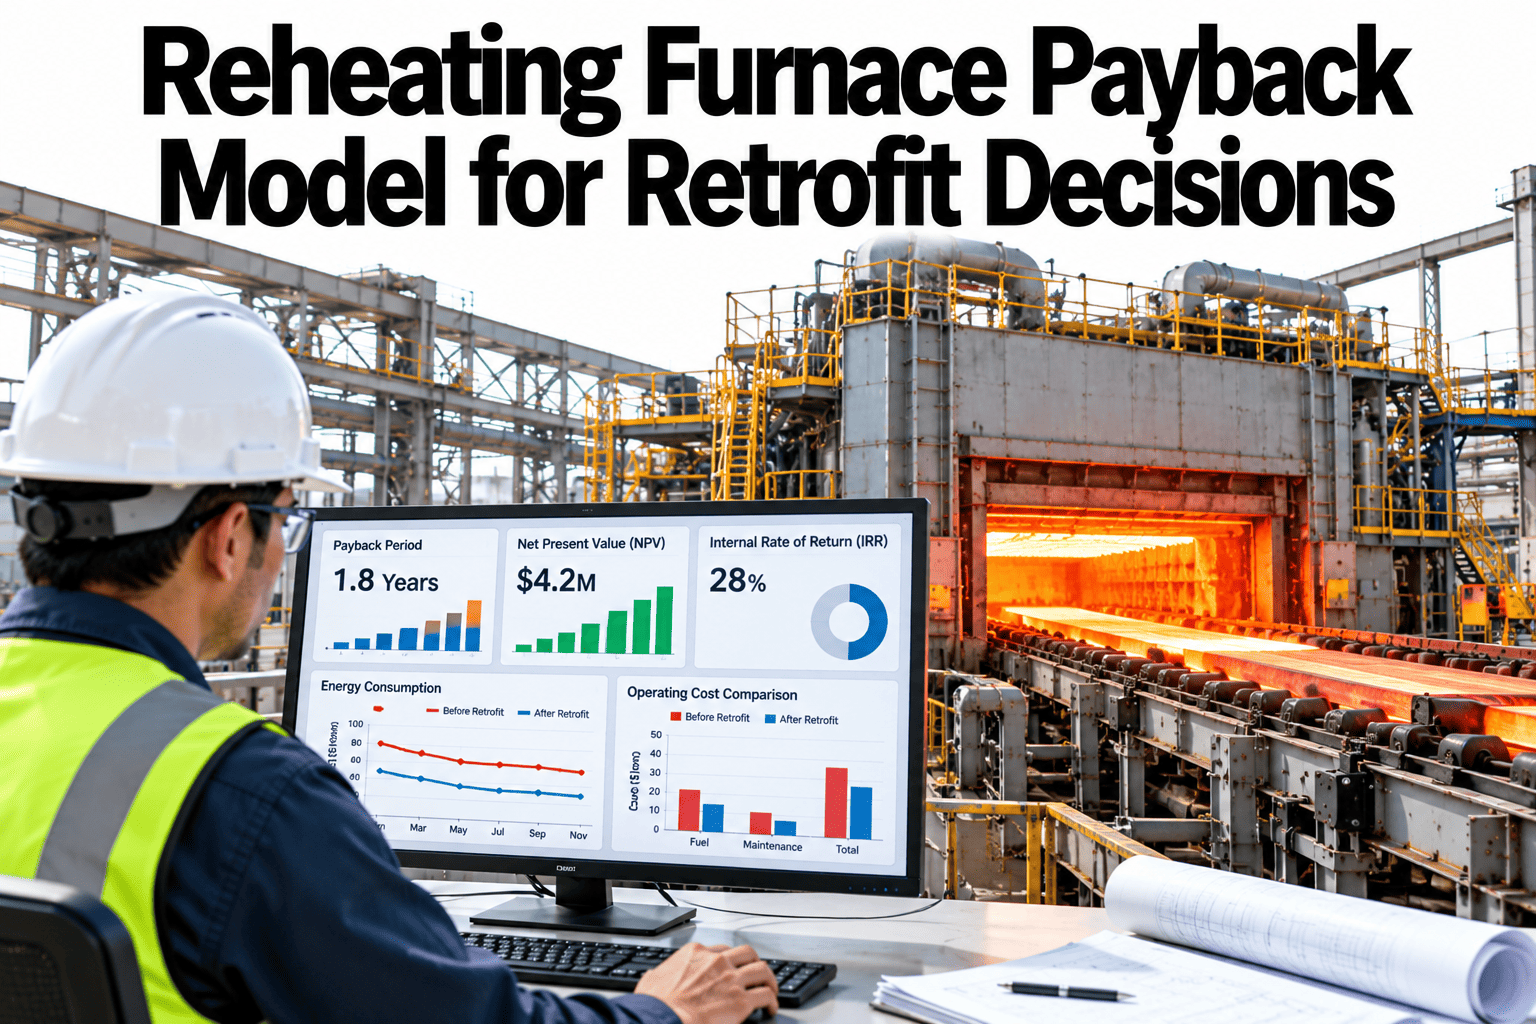
A reheating furnace retrofit can mean new burners, better insulation or a control upgrade, and each option competes for the same capital budget. A payback model puts them on equal terms by comparing investment, annual savings and the risks that come with each. Simple payback is a good first filter, but fuel price, outage cost and overlapping savings can change the ranking. To build a model with your own numbers, you can walk through a retrofit payback case with our team.
Reheating furnace investment decisions
Compare Furnace Retrofit Options on Payback Before You Commit Capital
iFactory AI helps steel mills estimate savings, rank retrofit options and build the evidence that finance teams need to approve furnace investments.
Illustrative simple payback in years
The decisionThree Common Retrofits Compete for One Budget
Each retrofit saves fuel in a different way and carries a different cost and risk.
Controls
Software and instruments that tune firing
Burners
New or upgraded burners and combustion hardware
Insulation
Refractory and structural heat retention
Combination
Packages with overlapping savings
Comparing them fairly means looking at cost, savings, time and risk together, not only the headline payback.
The core formulasSimple Payback and a Fuller Value View
Simple payback is easy to explain and a good first screen. Net present value adds the time value of money.
Simple payback (years) = investment / annual net savings
Annual net savings = fuel saved x fuel price + other savings - added running cost
Use simple payback to shortlist, then use net present value to compare the finalists on equal terms.
A worked comparisonThree Options Against an Illustrative Fuel Bill
Assume the furnace burns fuel worth 6,000,000 a year. All numbers are illustrative.
| Option | Investment | Fuel saving | Annual saving | Simple payback |
|---|
| Control upgrade | 450,000 | 5% | 300,000 | 1.5 years |
| Burner replacement | 1,600,000 | 8% | 480,000 | 3.3 years |
| Insulation upgrade | 1,200,000 | 4% | 240,000 | 5.0 years |
Savings from different options overlap. Two options that each save five percent rarely save ten percent together.
Build a Payback Case for Your Own Furnace
Share your fuel bill, production plan and shortlist of retrofits and see how iFactory AI would estimate savings and rank options.
Beyond the headlineFive Items That Often Get Left Out
1
Outage cost
Lost production while the furnace is down for work.
2
Interaction between options
Savings overlap, so totals are lower than the sum.
3
Carbon cost
Fuel savings may carry carbon value now or in future.
4
Maintenance effects
New equipment may reduce or add upkeep.
5
Product quality
Better temperature control can reduce rejects.
Add these to the model, even as ranges. A transparent estimate with ranges is more credible than a precise figure with hidden assumptions.
Investment and paybackA Simple Map for Prioritising Projects
Project profile
Short payback
Long payback
Low investment
Do first
Quick, cheap wins
Plan and justify
Strong returns but needs funding
High investment
Do if easy
Small spend, slow return
Challenge
Large spend, slow return
Most mills combine one or two quick wins with a larger project that has a strong long-term case.
SensitivityHow Fuel Price Changes the Answer
Payback depends heavily on fuel price. This table recalculates the control upgrade with different prices. It is illustrative.
| Fuel price change | Annual saving | Simple payback |
|---|
| Minus 20% | 240,000 | 1.9 years |
| Base case | 300,000 | 1.5 years |
| Plus 20% | 360,000 | 1.3 years |
Test at least three fuel price cases, since price swings are often the biggest uncertainty.
Two ways to judgeSimple Payback Versus a Lifecycle View
Simple payback only
Easy and fast to compute
Ignores what happens after payback
Treats all years the same
Can favour small, short-life projects
Lifecycle view
Includes net present value and equipment life
Counts benefits after payback
Reflects cost of capital
Compares options of different lifespans
Use both views. To set up a model that does, ask our team for a payback and net present value template.
Decision pathFive Steps From Idea to Approved Project
1
Measure the baseline
Record fuel per tonne, production and furnace condition.
2
List the options
Include controls, burners and insulation.
3
Estimate savings
Use data, not only supplier claims.
4
Model cost and risk
Add outage, overlap and price cases.
5
Present the shortlist
Share ranges and recommendations with finance.
Decision bandsTurn Numbers Into a Clear Recommendation
Approve
Short payback, strong evidence and manageable risk.
Investigate
Promising but needs better data or a pilot.
Decline or defer
Weak return or high risk at current assumptions.
Fuel use and cost baseline recorded
Savings estimated from furnace data
Outage and installation costs included
Overlap between options reviewed
Fuel price and carbon cases tested
Payback and net present value both calculated
Finance has reviewed the method
Measurement plan ready for after the retrofit
Retrofit options explainedSix Furnace Upgrades in Plain Language
Different upgrades attack different parts of the energy balance.
Control upgrade
Instruments and software that tune firing, air and setpoints.
Burner replacement
New burners that improve efficiency, flame stability or emissions.
Air preheat or recuperator
Equipment that recovers flue gas heat to warm combustion air.
Insulation and refractory
Better materials that reduce heat loss through walls and roof.
Skid and support insulation
Reduces cooling losses at slab supports.
Waste heat recovery
Uses leftover heat for steam, water heating or other needs.
Many mills combine several upgrades. The model should show both individual and combined effects.
Estimating savingsFour Steps From Idea to Number
1
Measure the baseline
Record fuel per tonne by product and period.
2
Find the loss
Work out which part of the energy balance the upgrade attacks.
3
Estimate the effect
Use data, trial results or similar plant evidence.
4
Test the range
Run low, base and high savings cases.
Present a range. Single-point estimates attract challenge and rarely survive review.
Strength of evidenceNot All Savings Claims Are Equally Reliable
Supplier claim
Useful for ideas but needs checking.
Similar plant case
Better, though conditions differ.
Your own data analysis
Strong, because it uses your furnace and products.
Pilot or trial result
Strongest evidence before full spending.
Ask which layer each number comes from. Decision makers should weigh them accordingly.
Where the money goesAn Illustrative Cost Split for a Burner Retrofit
Equipment is only part of the cost. This split is illustrative.
45 percent: Equipment
Burners, valves, controls and spares.
25 percent: Installation
Labour, cranes, piping and electrical work.
20 percent: Outage
Lost production during the shutdown.
10 percent: Commissioning
Tuning, testing and training.
Outage cost is easy to underestimate. Plan work around scheduled shutdowns wherever possible.
Who needs to agreeFour Groups Shape the Approval
Operations
We worry about outage length and production risk.
Maintenance
We care about reliability and spare parts.
Finance
We want clear numbers and ranges.
Sustainability
We value lower emissions and carbon reporting.
Show each group the part of the model it cares about. To prepare a stakeholder-ready pack, ask our team for a retrofit decision pack.
Approval pathThree Gates Before Money Is Released
Technical gate
Confirm the option suits the furnace, products and safety rules.
Financial gate
Review payback, net present value and risk cases.
Delivery gate
Agree outage plan, suppliers, testing and savings measurement.
Expert reviewWhat a Plant Finance Partner Would Check First
Expert review
A retrofit case succeeds when savings are measured and not only promised. Agree how you will verify the result before the money is spent.
VerdictStrong when baselines, overlap and outage costs are explicit.
Watch forSupplier savings figures used without checking them against furnace data.
Do nextMeasure a baseline now and model three fuel price cases for each option.
Frequently asked questionsWhat Mill Leaders Ask About Retrofit Payback
What payback should we expect from a control upgrade?
Control upgrades usually cost less than hardware changes and often pay back faster, but the figure depends on your furnace, current control and fuel cost. Use your own baseline and ranges rather than a generic number.
Build a control upgrade case.
Why do the combined savings of two projects fall short?
Both projects reduce the same fuel waste, so the second has less left to save. Model combinations directly instead of adding individual savings, and test the order of implementation.
Ask about combined project modelling.
Should we include carbon costs in the model?
If carbon costs or reporting affect your business now or are likely to, include them as a separate case so decision makers can see their effect. Show results with and without carbon value.
Discuss carbon cases.
How do we verify savings after the retrofit?
Agree a baseline, normalise for production mix and weather and compare fuel per tonne before and after. Document the method with finance before work starts.
Ask about savings verification.
What if suppliers quote different savings?
Ask each supplier for the assumptions behind the figure, and compare them against your own furnace data. A trial or advisory phase can test claims before large spending.
Review supplier claims with us.
Spend capital where it pays back
Back Your Furnace Investment With Evidence
Book a session with iFactory AI to measure your baseline, compare retrofit options and prepare a payback case your finance team can trust.