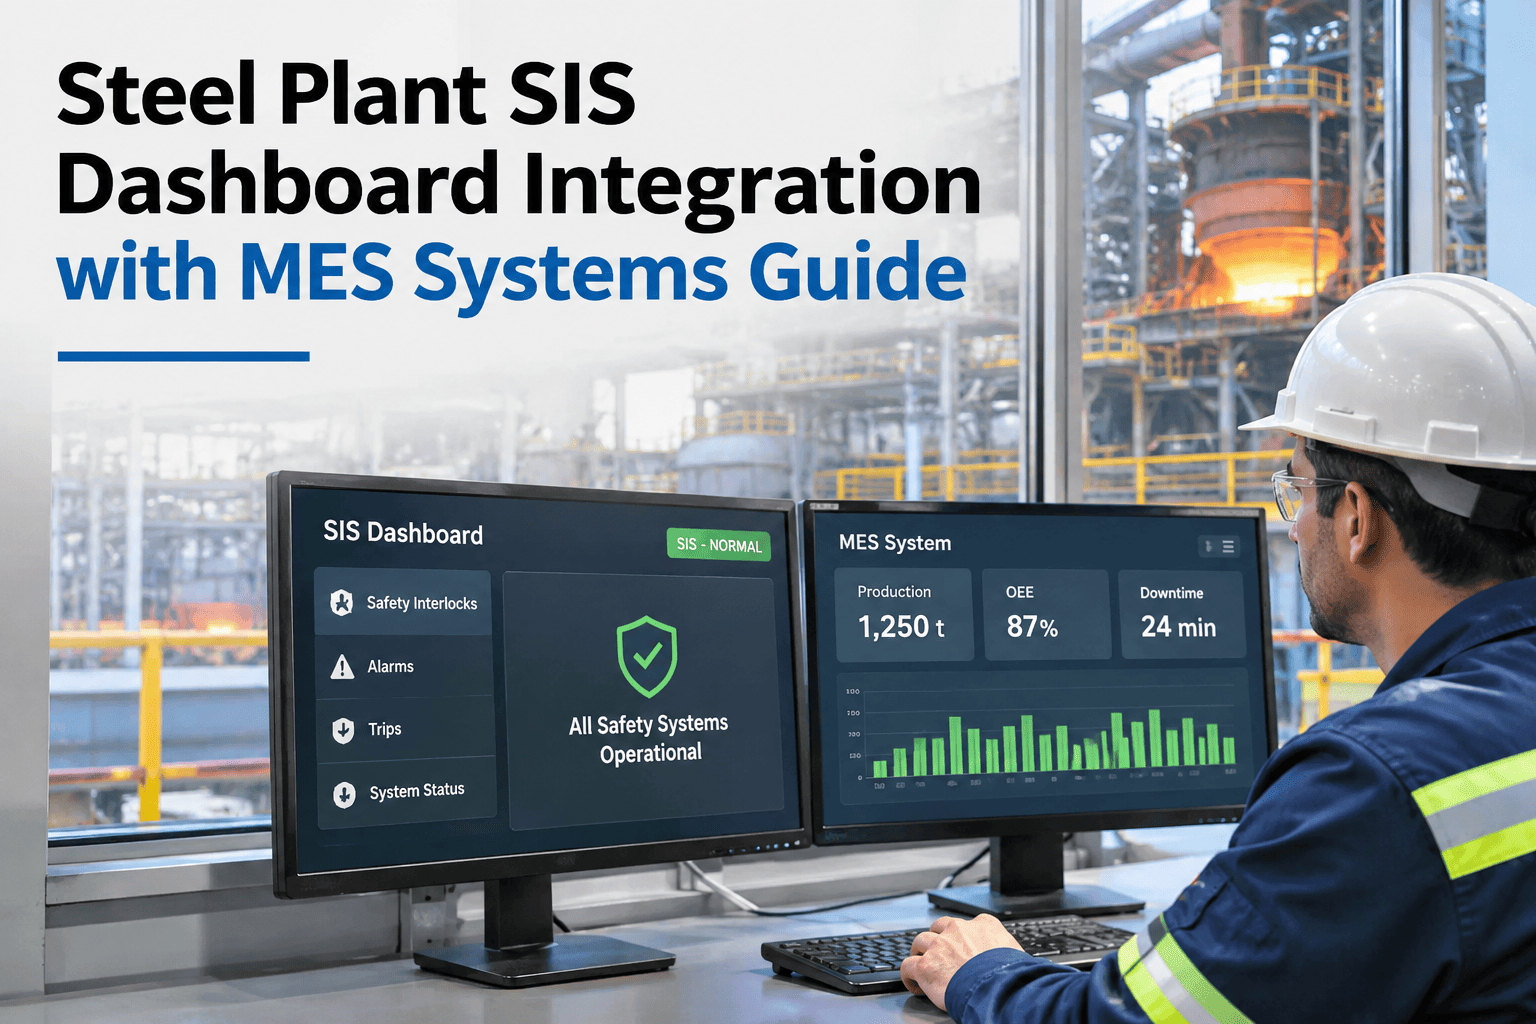
A unified steel plant dashboard is only as good as the pipeline feeding it, and that pipeline has to cross from Level 2 process control through Level 3 MES to a historian without ever touching the core control logic that actually runs the plant. iFactory, an on-premise AI platform with MES and energy dashboard capability built in, pulls this data through a read-only pipeline designed around exactly that constraint. Steel plant IT and operations teams who want this architecture applied to their own systems can request a demo with our team.
SIS Dashboard Integration · Steel Plant MES, 2026
The Dashboard Pipeline Has to Cross Three Layers Without Touching the Core
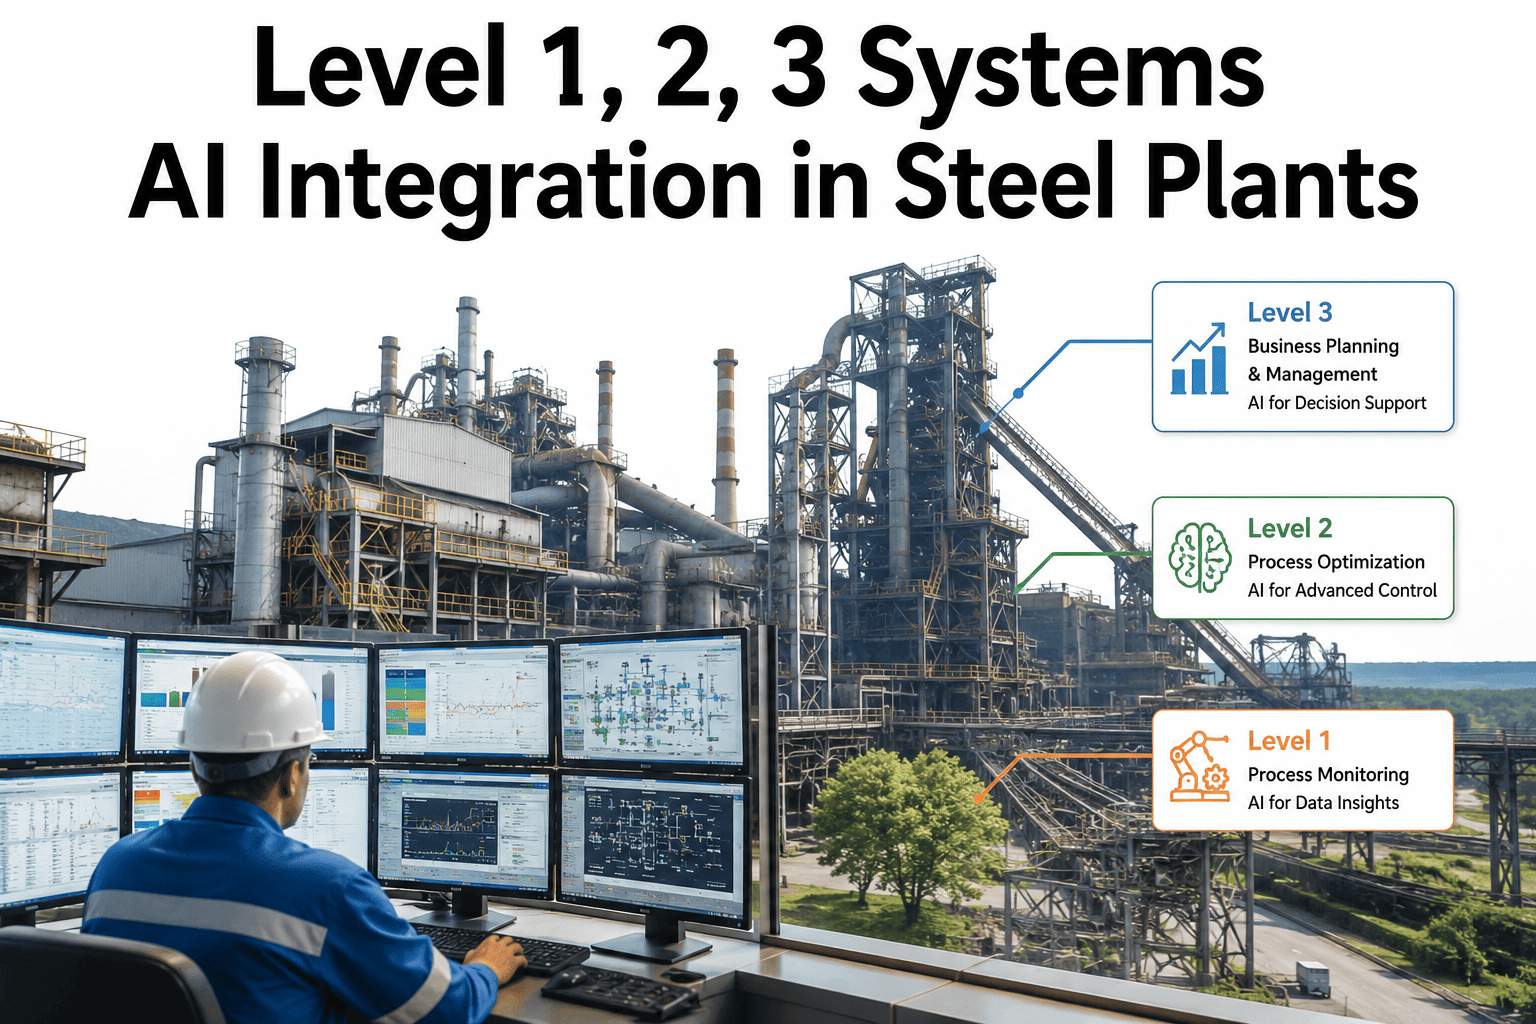
iFactory AI pulls Level 2 and Level 3 data into a unified dashboard through a read-only path, so analytics never risk the control logic running the plant.
Level 2
Process control, PLCs, basic automation
Level 3
MES — production execution, quality, scheduling
Dashboard
Historian-fed, read-only, unified view
Why this crossing is risky if done wrong
Level 2 Is Not a Place for a Dashboard Project to Make a Mistake
Level 2 systems run the actual process — a misconfigured read request, an overloaded network tap, or a poorly scoped connection at this layer carries real operational risk, not just an inconvenience. That's exactly why dashboard integration projects should pull from a historian or a Level 3 MES data store rather than querying Level 2 controllers directly, keeping the dashboard pipeline entirely downstream of anything that could affect control.
What feeds the dashboard
Three Data Sources, Each With a Different Role
Historian
Time-series process data, already decoupled from live control, the safest source for continuous metrics.
MES production records
Order, batch, and quality context that gives the raw process numbers their meaning.
Energy and carbon meters
Dedicated metering feeding the unified energy and carbon view alongside production data.
What this pipeline enables vs risks if skipped
Read-Only Pipeline vs Direct Querying
| Approach | Risk to core systems | Dashboard freshness |
|---|
| Direct Level 2 query | Real risk of network load or misconfiguration affecting control | Fastest possible, but not worth the risk |
| Historian-fed, read-only | None — pipeline is fully decoupled from control | Near real-time, with a small, acceptable lag |
See How Your Current MES and Historian Data Could Feed a Unified Dashboard
Share your current Level 2, Level 3, and historian setup, and iFactory AI will walk through a read-only pipeline design for your specific plant.
Keeping the core undisturbed
Four Principles That Protect Core Operations
1
Read-only, always
The dashboard pipeline never writes back to Level 2 or Level 3 systems.
2
Pull from the historian, not the controller
The historian is built to be queried; a live PLC is not.
3
Rate-limit and schedule queries
Dashboard refresh frequency is tuned to avoid any meaningful load on source systems.
4
Monitor the pipeline itself
A failed data pull should be visible as a dashboard issue, not mistaken for a plant issue.
Expert review
What a Plant IT Manager Checks First
A dashboard integration project earns trust when the operations team never has to worry about it affecting the control systems it reports on.
Verdict
Strong when every data pull is read-only and sourced from the historian, never a live Level 2 controller.
Watch for
A dashboard refresh rate set faster than the source systems were ever designed to support.
Do next
Confirm which of your current dashboards, if any, query Level 2 systems directly rather than through the historian.
Frequently asked questions
What Steel Plants Ask About SIS Dashboard Integration
Does pulling dashboard data risk slowing down our control systems?
Not when the pipeline is designed correctly — pulling from a historian rather than directly querying Level 2 controllers keeps the dashboard entirely decoupled from anything that could affect live control.
Discuss a safe pipeline design for your plant.
How fresh can the dashboard data actually be with a read-only, historian-fed approach?
Do we need a new historian to do this, or can we use our existing one?
Most plants already have a historian in place that can serve this purpose — the integration work is usually about connecting to it properly, not replacing it.
Discuss your current historian setup.
How do we monitor whether the dashboard pipeline itself is healthy?
The pipeline should have its own monitoring, separate from plant monitoring, so a failed data pull is correctly identified as a dashboard issue rather than mistaken for an actual plant problem.
Ask support about pipeline health monitoring.
Can energy and carbon metering be added to the same dashboard pipeline?
Cross the layers without touching the core
Build a Unified Dashboard Pipeline That Never Risks Control
Book a demo to see how iFactory AI pulls Level 2, Level 3, and historian data into one dashboard safely.