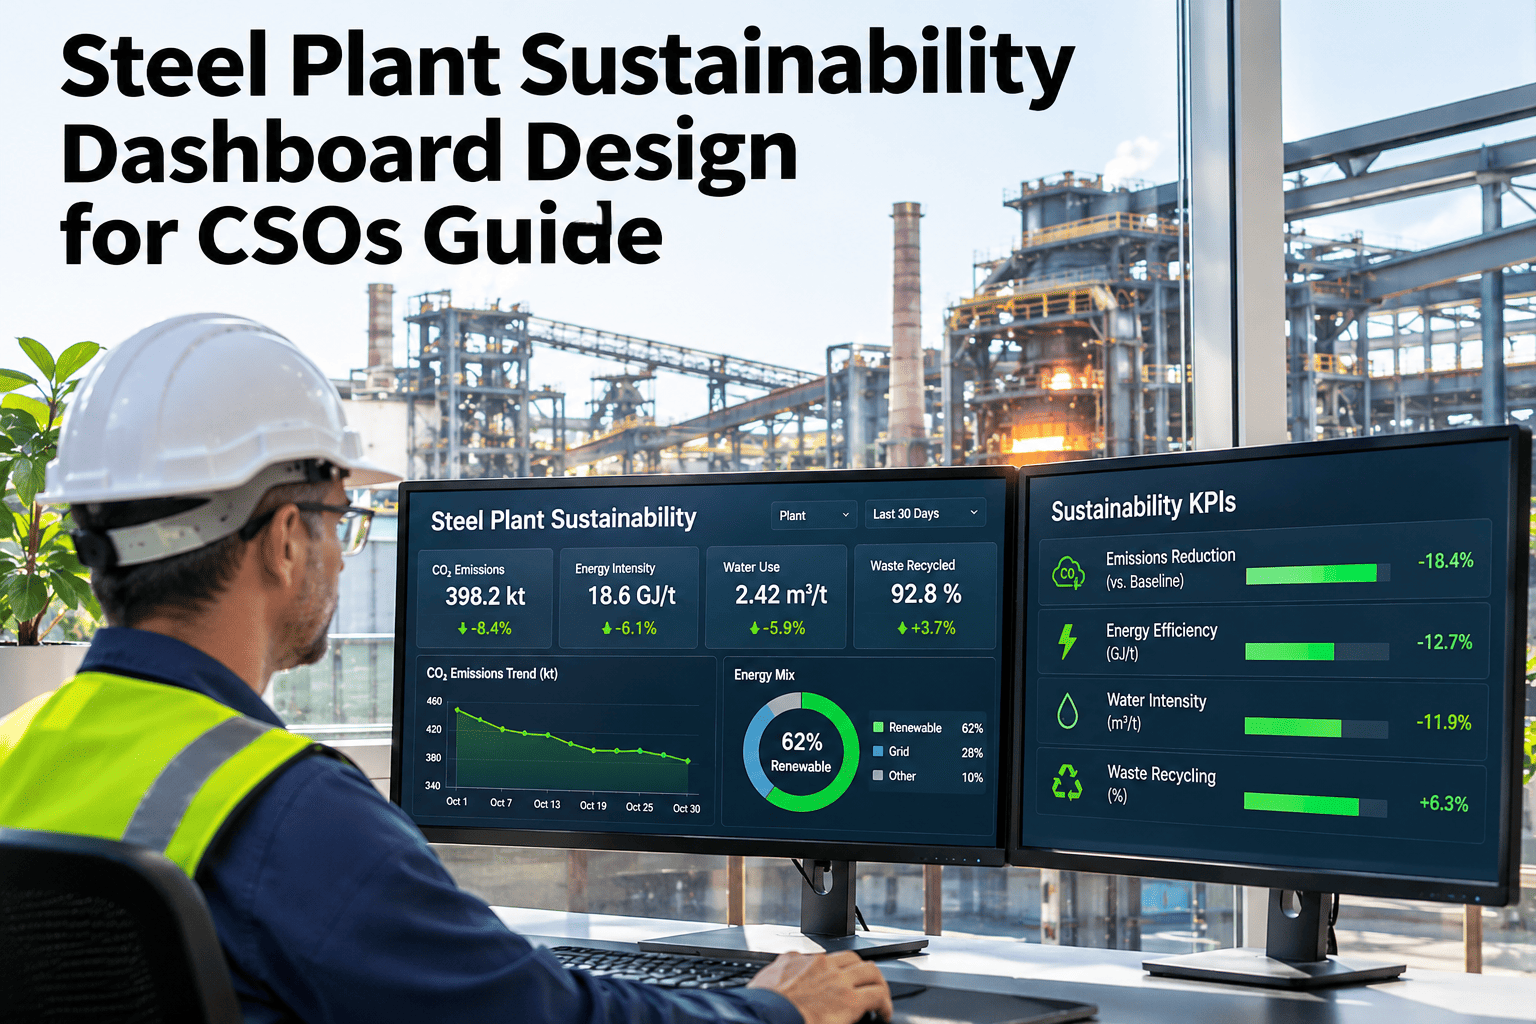
Most sustainability dashboards fail the board not because the numbers are wrong, but because the layout invites the wrong question. A CSO dashboard built as three disconnected charts — a Scope total, a target line, and a list of initiatives — forces the board to do the math that connects them. iFactory, an on-premise AI platform for steel plant sustainability reporting, designs the three views to sit on one screen so the connection is visible, not inferred. See the three-view layout.
Three Views, One Screen, No Follow-Up Question
Scope tracking, target progress, and initiative attribution answer different questions — a board shouldn't have to flip between dashboards to connect them.
Not "What's Our Carbon Number." "Why Did It Move."
A dashboard that only shows the current Scope 1/2/3 total answers a question nobody in the room is actually asking.
- A number alone → invites "is that good or bad," which the dashboard didn't answer.
- A number next to a target line → invites "why are we off track," which still needs the third view.
- A number, a target, and initiative attribution together → answers "why did it move" without anyone asking.
Scope 1, 2, 3 — Show Trend, Not Just Total
A single current-period emissions figure invites the board to compare it to something, usually from memory, usually wrong.
| Layout choice | What it prevents |
|---|---|
| Trailing 8-quarter trend line, not a single bar | Board members anchoring on a remembered number instead of the real trajectory |
| Scope 1, 2, 3 stacked, not blended into one total | A Scope 2 grid-factor swing being mistaken for an operational change |
| Intensity (tCO2/tonne) shown beside absolute tonnes | A production-volume shift being read as a sustainability win or loss |
Does Your Current Dashboard Pass This Test?
Send a screenshot of your current CSO or board-facing view — the team will show exactly where it forces a follow-up question that a layout change could answer directly.
Target Progress — Show The Pathway, Not Just The End Point
"On track for 2030" is meaningless without the interim milestones a board can check this quarter.
- End-point-only targets → nobody can tell if this quarter's number is a problem until 2029.
- A plotted pathway with interim checkpoints → a gap shows up the quarter it happens, not five years later.
The design choice here is a line chart showing the committed pathway against the actual trajectory, with the gap between them called out numerically — not buried in a percentage that still needs explaining.
Initiative Attribution — Connect Every Reduction To A Named Project
A target-progress chart that improves with no visible cause reads as either luck or a modeling error, and a board will assume the worse of the two.
- Waste-heat recovery project → attributed tonnes, tracked against its own completion milestone.
- Electrification of auxiliary load → attributed tonnes, tracked separately from grid-factor noise.
- Unattributed movement → flagged explicitly as unexplained, not hidden inside a rounding margin.
The Number Was Right. The Layout Made It Look Wrong.
A CSO walks into a quarterly board review with a dashboard showing total Scope 1+2 emissions ticking up 4% quarter over quarter. The number is correct — but the dashboard blends Scope 1 and Scope 2 into one line, so there's no way to see that Scope 1 actually fell 6% from a completed waste-heat project, while Scope 2 rose 11% purely from a grid emissions-factor update outside the plant's control. The board spends twenty minutes debating whether the sustainability program is failing. It wasn't. The dashboard just never separated an operational win from a grid-side number nobody at the plant could have changed.
Who Sees The Dashboard First Should Decide What It Leads With
A dashboard built for the compliance team and handed to the board unchanged leads with the wrong thing for that audience.
- Compliance team's first question → "is every emission source captured and categorized correctly?" → leads with scope boundaries and methodology.
- Board's first question → "are we on track, and why or why not?" → leads with target-pathway progress and attribution.
The same underlying data can serve both audiences, but only if the dashboard is designed with the viewer in mind rather than built once and reused for every meeting. A board deck that opens with methodology footnotes has already lost ten minutes before the actual question gets asked.
Compliance Detail Belongs One Click Away, Not On The Summary View
A CSO summary view crowded with CBAM line items and emission-factor citations buries the three questions a board actually has.
- Regulatory framework detail → CSRD, CBAM, SBTi documentation → one click deeper, for the compliance team, not the board's first screen.
- Raw emission-factor tables → audit material → referenced, not displayed, on the executive view.
Could Someone Outside Sustainability Read This Without You Present?
A dashboard that only makes sense with the CSO narrating next to it isn't a dashboard — it's a prop for a verbal explanation.
- Hand the summary view to someone from finance or operations → can they explain in thirty seconds whether the plant is on track?
- If they can't → the layout is hiding the connection between the three views instead of showing it.
Three Views, Same Data Foundation, Different Audiences
iFactory's dashboard layer builds Scope tracking, target-pathway progress, and initiative attribution from one shared data foundation, then presents them together on the CSO and board view rather than as three separate reports that have to be reconciled by hand.
- Scope 1, 2, 3 trend and intensity shown side by side, not blended into one total.
- Target pathway plotted with interim checkpoints, not just an end-year commitment.
- Every attributed tonne linked to a named initiative, with unexplained movement flagged rather than hidden.
- Compliance and audit detail available one click deeper, kept off the board-facing summary.
What A CSO Should Check Before The Next Board Deck
A dashboard is board-ready when every number on it answers a "why" without the CSO having to explain it verbally.
What CSOs Ask About Sustainability Dashboard Design
Yes — blending them into one total hides whether a change came from plant operations, grid factors, or supply chain, which a board needs to know. See a separated-scope layout with the team.
Trend, target progress, and initiative attribution belong on the summary; CBAM line items, emission-factor tables, and audit detail belong one click deeper. Ask support how the drill-down is structured.
A single line for the committed pathway against actual trajectory, with interim checkpoints marked, keeps it readable while still showing whether this quarter is a problem. Walk through a pathway chart example.
Flag it explicitly as unexplained rather than folding it into a rounding margin — an honest gap is more credible to a board than a number that mysteriously balances. Talk through attribution gaps with the team.
Yes — the board-facing design sits on top of the same compliance data foundation, it just presents it differently for a different audience. See how the layers connect.
Review Your Dashboard's Layout With The iFactory Team
Book a session and find out which of your three views — Scope tracking, target progress, or initiative attribution — is forcing a question your board shouldn't have to ask.