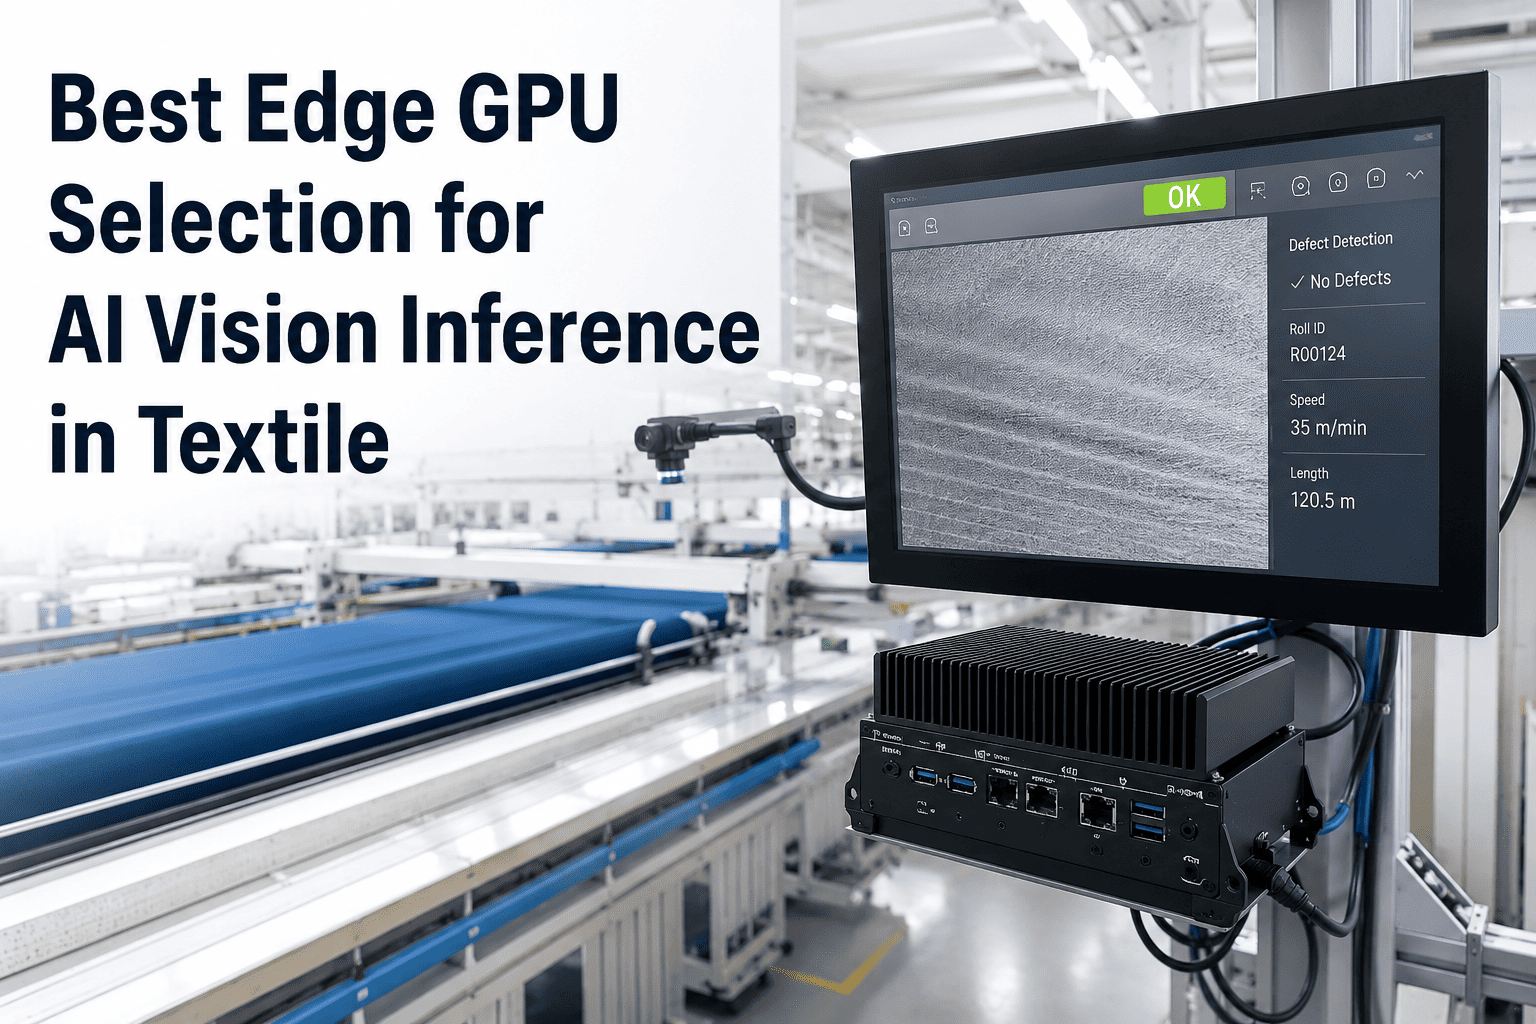
A textile inspection line running at 60 meters per minute gives an AI model roughly 15 to 20 milliseconds to capture a frame, run inference, and return a defect decision before the next section of fabric has already passed the camera. Pick an edge GPU with too little compute for that budget and the line either slows down to match the hardware or the model starts dropping frames it never had time to inspect. Pick hardware sized for a use case ten times larger than the actual workload and the mill pays for compute it will never use. iFactory's engineering team runs a workload assessment before specifying any hardware, matching camera count, model complexity, and line speed to the right module. To see that assessment run against your own line speed and camera count, book a demo.
TEXTILE AI · EDGE GPU HARDWARE · INFERENCE SPEED
Match the GPU to the Line Speed, Not the Line Speed to the GPU
iFactory specifies NVIDIA Jetson and edge GPU hardware against your actual inspection workload — line speed, camera count, model complexity, and thermal environment — so inference never becomes the bottleneck on the floor.
The Inference Time Budget at Common Textile Line Speeds
Budget assumes a single 200mm inspection zone under the camera at each speed. Faster lines compress the time available for the full capture-to-decision loop, not just model inference.
WHY IT MATTERS
What Actually Happens When the GPU Is Undersized for the Line
Undersized inference hardware rarely fails loudly. It fails quietly, in one of three ways, and each one erodes trust in the AI system before anyone traces the problem back to the GPU module. Recognizing these symptoms early is what separates a mill that fixes the hardware spec from one that concludes the AI itself does not work.
01
Frame Skipping
The pipeline silently drops frames it cannot process in time, leaving gaps in coverage that never show up in a summary report — only in a defect that reaches the customer.
02
Forced Line Slowdown
Operators throttle the line to match inference speed, erasing the throughput gains the AI system was installed to protect in the first place.
03
Queued Decision Latency
Inference results arrive after the fabric has already moved past the reject mechanism, forcing a wider reject margin that discards good material along with bad.
HARDWARE TIERS
Reading the NVIDIA Jetson Family Against Real Textile Workloads
NVIDIA's Jetson lineup spans a wide power and compute range, and the textile use case rarely needs the top of that range. Matching module to workload starts with an honest count of camera streams and a realistic estimate of model complexity, not a default to the newest or most powerful part number available.
Best fit: single camera, one fabric family, lightweight defect classifier, slower narrow-width lines
Watch for: limited headroom if the product mix later expands to multi-fabric routing
Best fit: two to four camera streams, multi-class defect detection, standard wide-width production lines
Watch for: the most common sizing mismatch is under-provisioning this tier for a mill's actual camera count
Best fit: high-speed lines above 80 m/min, five or more camera streams, multi-fabric routing pipelines, redundant inference paths
Watch for: thermal design becomes the limiting factor before compute does at this tier
The power envelope figures above are directional guidance for workload planning, not a fixed vendor specification — actual module selection depends on the specific SKU generation available at deployment time and the precise inference load calculated during the workload assessment.
Let iFactory size the hardware instead of guessing
Send us your line speed, camera count, and fabric mix, and we return a specified hardware configuration matched to your actual inspection workload — not a generic recommendation.
THE FIVE INPUTS
What a Real Edge GPU Sizing Decision Actually Depends On
Selecting edge GPU hardware is a five-variable calculation, and skipping any one of them is what produces an under- or over-specified system. Vendors that sell hardware without walking through all five are selling a part number, not a working inspection system.
MODEL OPTIMIZATION
Why Quantization Often Buys More Speed Than a Hardware Upgrade
Before reaching for a more powerful GPU module, the highest-leverage lever is usually model optimization, not hardware. Converting a model to run through NVIDIA's TensorRT inference engine at reduced numerical precision routinely delivers large latency gains on the exact same silicon, and it is the step teams skip most often because it requires a calibration pass rather than a purchase order.
FP32
Full precision baseline. Highest accuracy ceiling, slowest inference, largest memory footprint.
FP16
Roughly half the memory footprint with meaningfully faster inference and minimal accuracy impact on most CNN-based defect detectors.
INT8
The fastest and smallest option, requiring a calibration dataset to hold accuracy — typically the deployment target once calibration is validated.
Independent benchmarking of common detection architectures on TensorRT shows the pattern clearly: FP16 conversion commonly halves latency compared with an unoptimized framework baseline, and INT8 pushes further still, with published YOLO-family benchmarks showing multi-fold throughput gains from FP32 baseline through TensorRT FP16 to TensorRT INT8 on the same GPU. The accuracy cost of INT8 is typically small when calibration is done properly — often under half a percentage point on mAP for well-calibrated CNN detectors — which is why INT8 has become the default deployment target for real-time industrial vision rather than an aggressive edge case.
This is also why hardware sizing conversations that skip the optimization question tend to over-specify. A model that appears to need a high-tier GPU at FP32 precision often runs comfortably on a mid-tier module once properly quantized, and getting this sequence backwards is the single most common source of wasted hardware budget in edge AI vision deployments.
Calibration is the step that determines whether INT8 conversion holds accuracy or quietly erodes it. A calibration dataset needs to represent the actual range of fabric conditions the model will see in production, including edge cases like unusual lighting or rare defect types, because a calibration set that only covers common conditions produces quantization scales that perform well on average but poorly on the tail cases that matter most for catching real defects. Teams that treat calibration as a formality rather than a deliberate curation step are the ones most likely to report disappointing INT8 results and conclude, incorrectly, that quantization itself was the problem.
THE FULL LATENCY PATH
Inference Speed Is Only One Stage in the Total Decision Loop
A GPU's raw inference benchmark number is not the number that determines whether a line can hold its speed. The total time budget spans five stages from photon to decision, and a bottleneck in any one of them defeats a fast GPU sitting idle in the middle of the chain.
1
Frame Capture
Camera sensor exposure and transfer over GigE Vision or MIPI CSI into the module's memory pool
→
2
Pre-processing
Resize, normalize, and color-space conversion, ideally run on-GPU to avoid a costly round trip to system memory
→
3
Model Inference
The optimized TensorRT engine executes on the GPU cores, the stage most people mean by inference speed
→
4
Post-processing
Non-maximum suppression, confidence thresholding, and business-rule logic applied to raw model outputs
→
5
Decision Output
Result written to the PLC or reject actuator over EtherCAT or OPC-UA, closing the loop on the physical line
Optimizing stage three alone while leaving an unoptimized pre-processing step on the CPU is a common way projects fail to hit their latency target even after buying capable GPU hardware — the fix is architectural, not a bigger part number.
SIZING TABLE
A Practical Starting Point for Matching Workload to Hardware Tier
The table below is a planning starting point, not a substitute for a proper workload assessment — actual sizing always depends on the specific model architecture and optimization level in use, both of which shift the calculation meaningfully.
| Workload Profile |
Camera Streams |
Typical Line Speed |
Suggested Tier |
| Single fabric, single defect class |
1 |
Under 30 m/min |
Entry |
| Single fabric, multi-class detection |
1–2 |
30–60 m/min |
Entry to mid |
| Multi-fabric routing pipeline |
2–4 |
40–70 m/min |
Mid |
| Wide-width, high-speed line |
3–5 |
70–100+ m/min |
Mid to high |
| Multi-line facility, centralized inference |
6+ |
Mixed across lines |
High or multi-module |
TURNKEY DELIVERY
How iFactory Turns a Sizing Decision Into a Running Inspection Line
Getting the GPU tier right on paper is only useful if the resulting system actually ships, integrates, and performs at spec on the floor. iFactory delivers the hardware as part of a turnkey bundle, pre-configured and matched to the workload assessment, with the network, PLC integration, and monitoring already accounted for.
What's Included
Edge GPU module sized to your workload assessment, pre-racked
TensorRT-optimized inference engine, calibrated for your defect classes
Camera and illumination hardware matched to line width and speed
PLC/OPC-UA integration for closed-loop reject actuation
24×7 remote monitoring with latency and throughput alerting
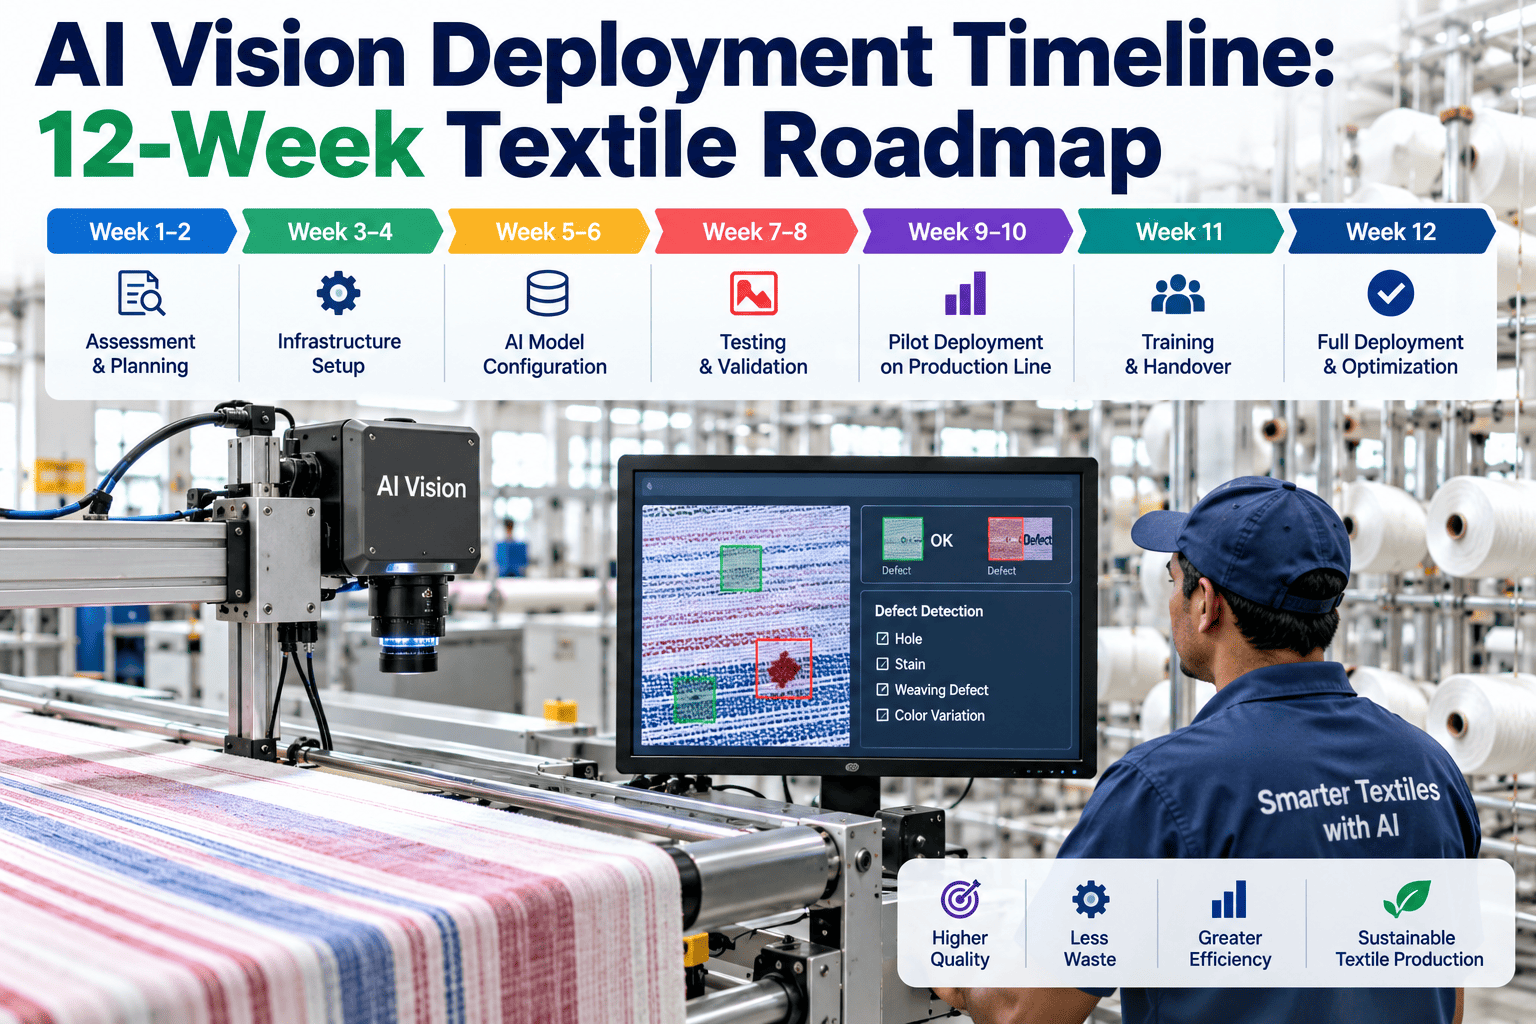
Deployment Timeline
Weeks 1–4: Hardware ships pre-configured, network and PLC integration on site
Weeks 5–8: Model calibration and TensorRT optimization, parallel pilot against existing QA
Weeks 9–12: Go-live at full line speed, operator training, monitoring active
COMMON MISTAKES
Where Edge GPU Sizing Decisions Go Wrong in Practice
Most hardware sizing mistakes are not exotic engineering errors, they are predictable planning gaps that repeat across mills and product categories. Recognizing the pattern before signing a purchase order saves both the cost of over-specified hardware and the disruption of discovering an under-specified system after it is already installed on the floor.
Sizing to Peak Line Speed Only
A mill's fastest rated line speed is often not its typical operating speed, but hardware bought for the rare peak leaves capacity idle most of the time. Size for the realistic operating envelope and validate against the true peak separately.
Benchmarking on the Wrong Model
A vendor's published inference benchmark for a generic object detector rarely matches the latency of the specific defect model your mill will actually deploy. Always validate on your own model, not a reference architecture.
Ignoring Sustained Versus Burst Performance
A GPU module's headline compute figure often reflects short burst performance, not what it sustains continuously across an eight-hour shift once thermal throttling and power limits are factored in.
Treating Optimization as Optional
Skipping TensorRT conversion and deploying a framework-native model directly on the edge GPU routinely costs several times the achievable inference speed, pushing teams toward hardware upgrades they did not actually need.
The common thread across all four mistakes is the same: sizing decisions made from a spec sheet rather than from a validated benchmark against the actual model, actual line conditions, and actual optimization level the deployment will run. A workload assessment exists specifically to close that gap before capital is committed, and it typically pays for itself many times over against the cost of either an emergency hardware swap after go-live or a chronically over-provisioned system sitting underutilized for years.
MONITORING IN PRODUCTION
How to Know the Hardware Spec Is Still Correct Six Months Later
A correctly sized GPU on day one does not stay correctly sized forever. Product mix shifts, model complexity grows as new defect classes are added, and line speeds sometimes increase as production targets change. Treating hardware sizing as a one-time decision rather than an ongoing metric is how a well-specified system quietly drifts into an undersized one.
Frame Drop Rate
Any sustained non-zero frame drop rate is a direct signal that the inference pipeline can no longer keep pace with the line, and it should trigger an immediate review rather than being tolerated as background noise.
P99 Latency, Not Just Average
Average latency can look healthy while the worst-case tail latency regularly exceeds the time budget, since it is the tail that actually causes missed decisions on the fastest-moving frames.
GPU Utilization Trend
A utilization trend climbing steadily toward its ceiling over months, even without a frame drop event yet, is the early warning that gives a mill time to plan a hardware or optimization change before it becomes urgent.
Thermal Throttle Events
Logged throttle events during peak ambient temperature periods indicate the enclosure or module is operating at its sustained performance ceiling, which is a capacity signal independent of the raw compute question.
iFactory's included 24×7 remote monitoring tracks all four of these signals continuously and flags a hardware review before a drift becomes a production incident, rather than waiting for a customer complaint to surface the problem. To see the monitoring dashboard for these exact metrics, book a demo.
FREQUENTLY ASKED QUESTIONS
What Textile Teams Ask Before Committing to Edge GPU Hardware
Do we need a different GPU for every camera on the line, or can one module handle several streams?
A single edge GPU module can typically handle multiple camera streams concurrently, since the compute is shared across the inference workload rather than dedicated per camera, but the headroom needed grows with each additional stream. The right number of streams per module depends on model complexity and the line's time budget — a mid-tier module comfortably running two streams at a relaxed line speed may need to drop to one stream, or move to a higher tier, once line speed or model complexity increases. This is exactly the calculation a proper workload assessment resolves before hardware is purchased.
Book a demo to size your specific multi-camera configuration.
Will INT8 quantization hurt our defect detection accuracy in a way that matters?
Properly calibrated INT8 quantization typically costs well under a percentage point of accuracy on CNN-based defect detectors, which is a small trade for the latency and throughput gains it delivers, and it is why INT8 has become the standard deployment target rather than an aggressive edge case. The calibration step matters — INT8 conversion done without a representative calibration dataset can produce a larger accuracy drop than the technique itself would suggest, which is the most common reason teams report disappointing quantization results. iFactory validates calibrated accuracy against a held-out benchmark before any INT8 model goes into production.
Contact our support team to review calibration results for your specific defect classes.
Our line runs three shifts in a hot facility — does that change the hardware recommendation?
Yes, sustained high-ambient-temperature operation is one of the five sizing inputs and it can shift the recommended tier upward even when the raw compute requirement would otherwise fit a lower tier, because thermal throttling reduces the performance a GPU module can sustain continuously. Enclosure design, airflow, and module selection all get evaluated together for continuous three-shift operations rather than treating thermal as an afterthought to the compute calculation.
Book a demo to walk through thermal planning for your specific facility conditions.
Is it better to buy hardware with headroom for future growth, or size exactly to today's workload?
Some deliberate headroom is worth budgeting for, particularly if the mill expects to add fabric families, additional camera streams, or higher line speeds within the hardware's expected service life, since a full tier upgrade later is more disruptive than provisioning slightly above today's exact requirement. That said, headroom should be a planned decision based on a realistic growth timeline, not a default to the most powerful available module, which simply wastes capital on compute the line will never use.
Contact our support team to model headroom scenarios against your expansion plans.
What happens if we size the hardware correctly but the total latency still misses our target?
This almost always traces back to a stage outside the GPU inference step itself — an unoptimized pre-processing pipeline running on CPU instead of GPU, a camera interface bottleneck, or a PLC communication delay in the decision-output stage — rather than the GPU module being undersized. Because the total latency budget spans five stages from frame capture to decision output, a correctly sized GPU sitting idle behind a slow pre-processing step is one of the most common and most fixable causes of a missed latency target.
Book a demo to have the full latency chain profiled against your current setup.
Get the Hardware Spec That Actually Matches Your Line
iFactory runs the full workload assessment — line speed, camera count, model complexity, quantization plan, and thermal environment — and returns a specified, turnkey hardware configuration built to hit your latency target, not a generic recommendation.