Blend Consistency: Cotton-Polyester Fiber Ratio Control
By James Smith on August 5, 2026
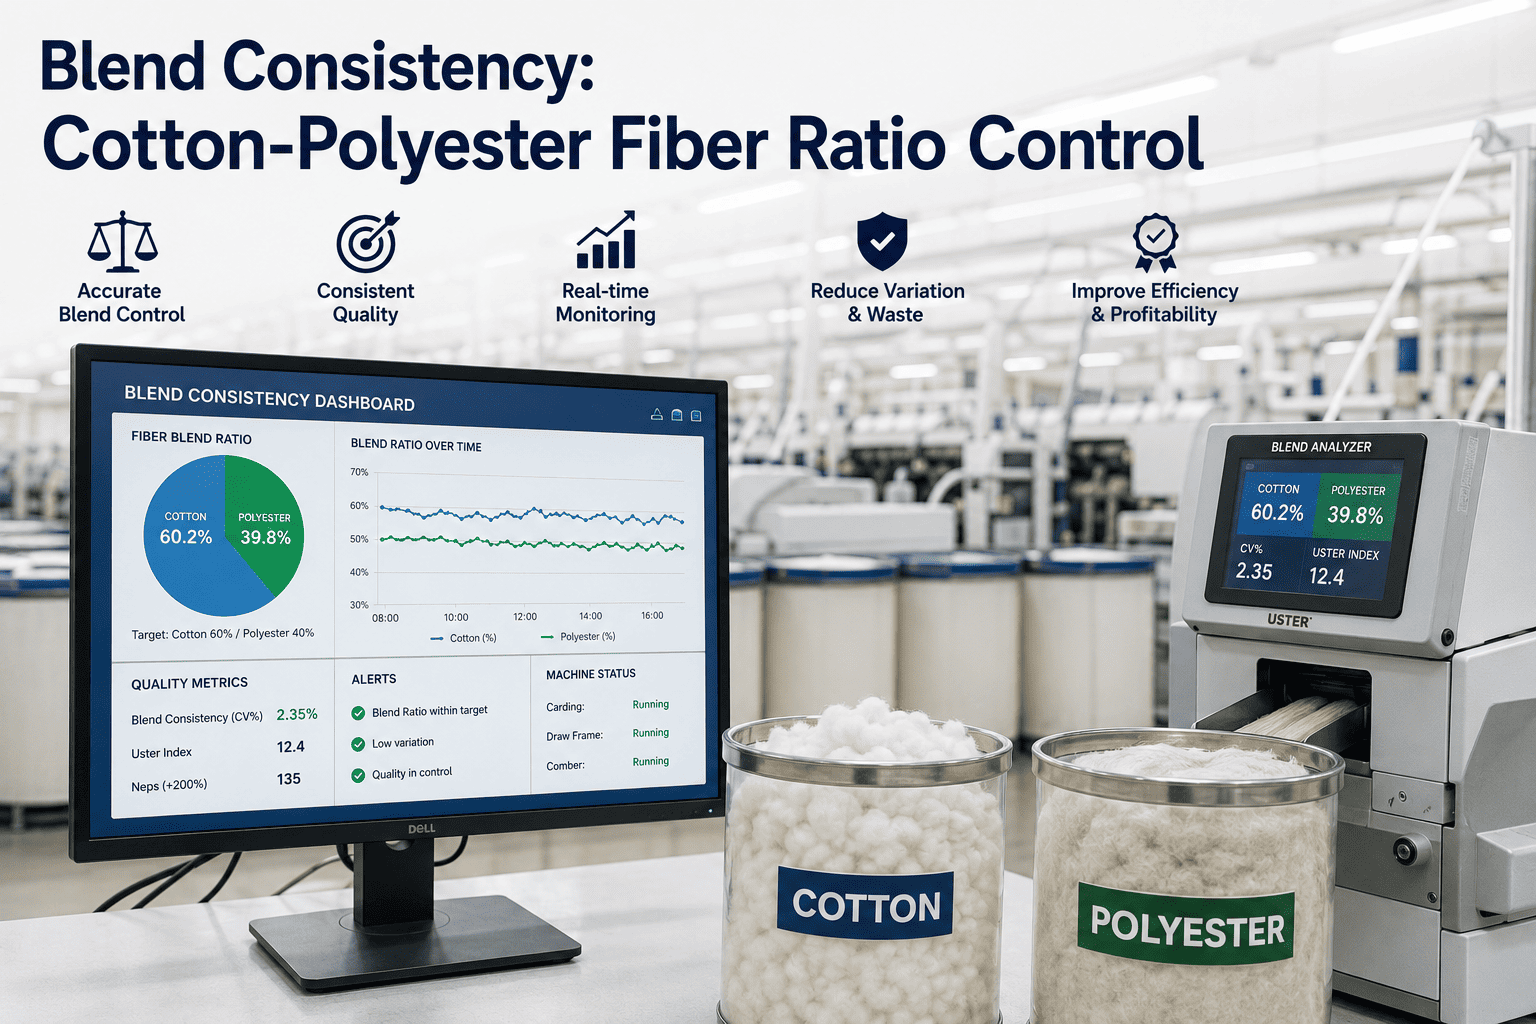
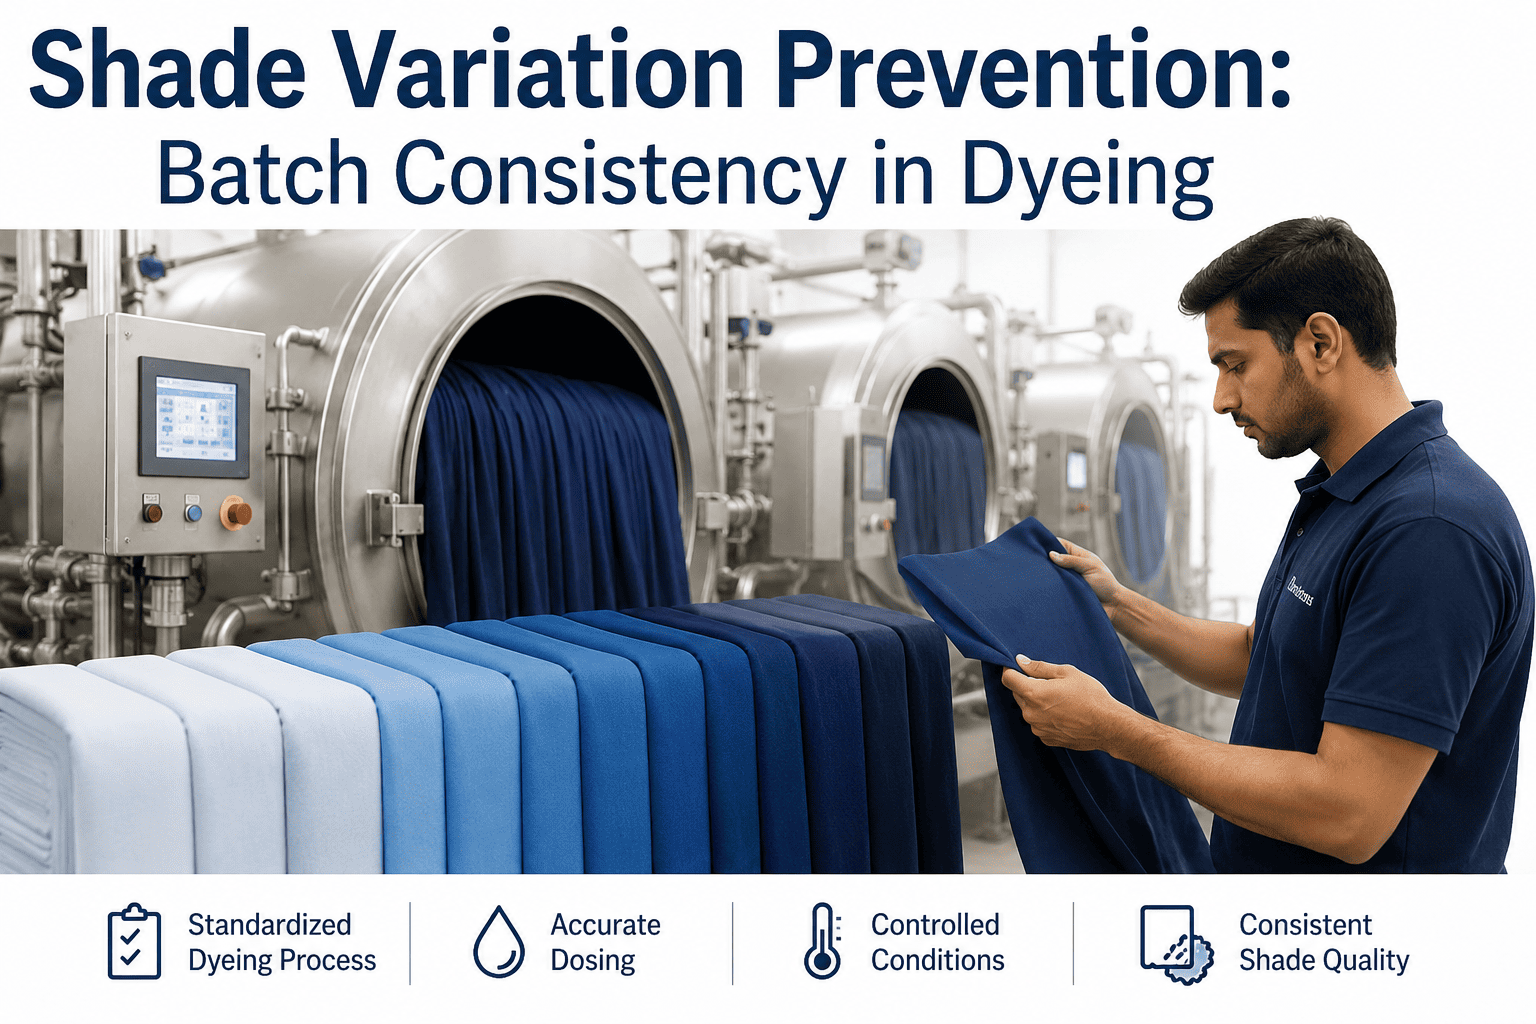
A cotton-polyester blend specified at 60/40 that drifts to 63/37 during production does not look like a quality failure on any shift report. The blend room operators met their targets. The opening line ran without stoppages. The carding output looked normal. The problem surfaces three weeks later when the dye house calls to report that two lots of 60/40 ring-spun yarn are producing visibly different shades on the same dye bath — because the actual fiber ratios were never the same to begin with. Blend ratio control is one of the least instrumented and most consequential quality variables in yarn manufacturing, and the gap between specified ratio and delivered ratio is almost always wider than the quality team believes. To see how iFactory's real-time blend monitoring closes that gap, book a session with our textile quality analytics team.
Yarn Quality · Fiber Blend Control
Blend Consistency in Cotton-Polyester Yarns: Real-Time Ratio Control from Blend Room to Ring Frame
A process engineer's technical reference for controlling fiber blend ratios across the full spinning preparation sequence — covering deviation sources, detection technologies, real-time monitoring architecture, and the downstream quality consequences of blend variation that make ratio control a business-critical discipline.
±2–4%
Typical undetected blend ratio drift in mills without real-time monitoring
ΔE 1.2–2.8
Dye shade variation caused by 3% blend ratio deviation in same dye bath
8–14%
Tensile strength variance attributable to blend ratio inconsistency alone
Real-time
Monitoring frequency required to prevent downstream blend-related defects
The Cascade Effect of Blend Variation: From Fiber Weight to Fabric Rejection
Cotton-polyester blends are engineered to specification because the ratio determines virtually every downstream property: moisture management, dye affinity, abrasion resistance, pilling propensity, handle, and tensile profile. A 60/40 cotton-polyester yarn is not interchangeable with a 63/37 yarn even though both are described as "cotton-rich." The fiber ratio is the recipe. When the recipe drifts, every downstream process — dyeing, finishing, garment construction — operates on a different material than the one it was designed for, and the costs accumulate silently until they surface as fabric defects, shade rejections, or customer complaints.
Blend Room
↓
Gravimetric drift during bale laydown → ratio variance enters at source
Blowroom / Opening
↓
Fibre separation differences between cotton and polyester cause selective opening → ratio shifts further
Carding
↓
Cotton nep removal rate differs from polyester → sliver blend composition diverges from feed
Draw Frame
↓
Doubling averages short-range variation but does not correct systematic ratio error
Ring Frame / OE
↓
Yarn delivered to winding — blend ratio now fixed and unalterable in wound package
Dye House / Fabric
⚠
Shade variation, strength inconsistency, and fabric hand deviation discovered — cost of correction is 8–25× the blend room correction cost
Blend Ratio Drift — Visualised
How Ratio Drift Accumulates Across a Production Shift Without Real-Time Detection
The chart below shows a typical blend ratio profile across a 480-minute production shift on a cotton-polyester line. The specification is 60/40. Upper and lower control limits are set at ±1.5%. Without real-time monitoring, most of the drift below passes through undetected.
Even modest sustained drift — cotton proportion rising from 60% to 62.5% over 3 hours — will produce visible shade variation in the dye house if the same lot is processed across multiple dye baths. Real-time monitoring with SPC control limits catches this drift at the T=260 minute point rather than at fabric inspection.
Deviation Root Causes
Where Blend Ratio Error Enters the Process — and Why It Is Hard to See
01
Bale Laydown Variation
The foundation of blend control is the bale laydown — the physical arrangement of cotton and polyester bales feeding the blowroom. Gravimetric variation within individual bales, differences in bale density between suppliers, and manual bale selection errors all introduce ratio error before the first opener runs. A bale laydown where cotton bales average 183 kg and polyester bales average 224 kg but are counted as equal in the blend calculation produces systematic under-counting of the heavier component.
Detection point: Bale weighing + laydown control system
02
Differential Opening Efficiency
Cotton and polyester have different mechanical opening characteristics. Cotton opens more readily at lower beater speeds; polyester at higher. In a mixed opening line, the beater speed selected for one component will over-open or under-open the other, producing a fiber mass with uneven density distribution between the two components. This density difference — invisible to a count-based blend check — translates into ratio deviation in the card sliver.
Carding removes neps, short fibres, and trash — but the waste rate is not equal between cotton and polyester. Cotton typically generates 3 to 6% card waste; polyester generates 0.5 to 1.5%. In a 60/40 cotton-polyester blend, the differential waste means the sliver delivered from the card is consistently higher in polyester proportion than the blend room formula specifies, unless the laydown calculation accounts for differential waste rates.
Blend room operators who observe a visual imbalance in the bale mix — more white polyester fibres visible at the surface, for example — will sometimes adjust the laydown informally without a formal recalculation. These undocumented adjustments may correct a real problem or introduce a new one, and because they are not recorded, quality investigations cannot trace ratio anomalies back to their origin in the blend room.
Detection point: Digital work order system with mandatory laydown sign-off
05
Supplier Lot Variation in Cotton
Cotton is a natural fibre with inherent variability between growing regions, crop years, and ginning methods. Moisture regain differences between cotton lots affect the effective dry weight of the fibre and therefore the true mass contribution to the blend. A cotton lot with 8.5% moisture regain contributes less dry fibre mass per kilogram than a lot at 6.2% — a difference that the nominal blend calculation ignores unless moisture correction is applied.
Draw frame autolevellers correct linear density variation in the sliver but operate on the assumption that the input slivers have consistent composition. If two out of six doubling ends at the draw frame are from a card that ran at an anomalous blend ratio, the draw frame will produce a sliver at the correct linear density but incorrect composition — and no standard draw frame monitor will detect the composition error.
Detection point: Per-card sliver tagging with composition traceability to draw frame
Detection Technology
Four Methods for Measuring Blend Ratio — Resolution, Speed, and Trade-offs
The choice of detection technology determines both how early you can catch ratio deviation and how frequently you can verify blend composition. Manual methods applied once per shift cannot catch the intra-shift drift that drives dye shade variation. The table below compares the four methods in current mill use.
Method
Measurement Principle
Resolution
Frequency Achievable
Integration Capability
Gravimetric (manual)
Weight-based blend calculation from bale laydown records
±2–4%
Once per laydown (shift or longer)
Low — paper-based
Burn test / dissolution
Chemical separation and weighing of fiber components
±0.5–1.5%
1–3 times per day
Low — lab only
Near-Infrared (NIR) spectroscopy
Spectral reflectance differences between cotton and polyester
±0.3–0.8%
Continuous (inline capable)
High — digital output
AI vision + image analysis
Fibre morphology classification from high-resolution imaging
±0.5–1.2%
Continuous (card/draw frame)
High — feeds SPC directly
NIR spectroscopy is the current standard for inline blend monitoring on high-speed lines. Installed at the card or draw frame output, it provides a composition reading every few seconds that feeds directly into an SPC control chart — enabling detection of ratio drift within minutes rather than hours or shifts.
Downstream Impact Matrix
What ±2%, ±4%, and ±6% Blend Deviation Costs at Each Downstream Stage
The financial case for blend ratio control is built from its downstream cost structure. A blend deviation that costs almost nothing to correct in the blend room compounds into significant costs at each subsequent stage. The matrix below quantifies the impact of three deviation levels across five downstream quality attributes.
Connect Blend Monitoring to Your Quality System
iFactory Tracks Blend Ratio in Real Time and Alerts Before Deviation Reaches the Card Sliver
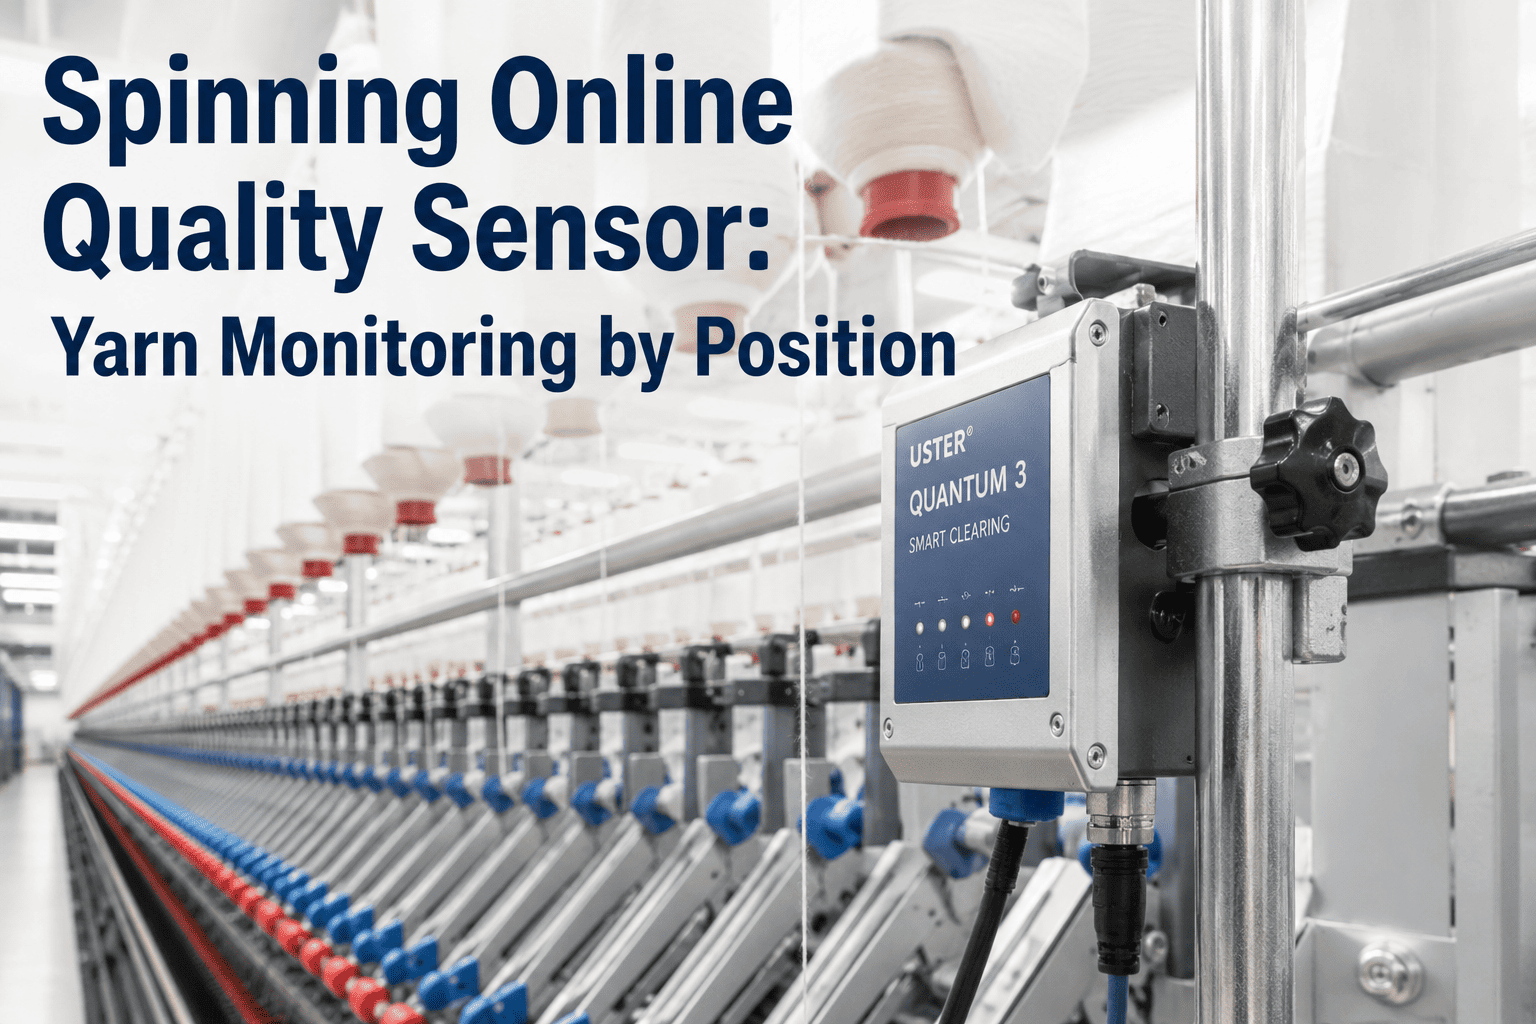
Most yarn mills discover blend ratio problems at the dye house — three to six weeks after the off-ratio production ran. iFactory's blend monitoring module connects to inline NIR sensors, gravimetric systems, and lab composition data to build a continuous ratio chart with SPC control limits, alerting blend room supervisors within minutes of a control limit breach.
A Four-Layer Control Architecture for Cotton-Polyester Blend Ratio Assurance
Effective blend ratio control is not a single measurement event — it is a layered system where each layer catches what the previous layer missed. Plants that rely on a single check point, however frequent, will always have windows of undetected deviation. The four-layer architecture below is the industry standard for high-confidence blend assurance on blended yarn lines.
Layer 1
Bale Management & Laydown Control
Frequency: Every laydown change
Digital bale laydown system records actual bale weights, moisture-corrected dry weights, and the planned versus actual ratio for each laydown. Any deviation from the nominal ratio triggers a supervisor approval before production starts. Laydown records are retained and linked to the production lots they fed.
Layer 2
Continuous Inline Monitoring (NIR / Gravimetric)
Frequency: Continuous — reading every 30–120 seconds
Inline sensors at the card output or draw frame input provide a composition reading stream that feeds directly into an SPC chart. Control limits are set at ±1.5% of nominal ratio. Breach of the upper or lower control limit triggers an immediate alert to the blend room supervisor with a recommended corrective action based on the deviation direction.
Layer 3
Periodic Lab Verification (Burn / NIR Bench)
Frequency: Once per 4 hours per blend type
Lab bench analysis provides the reference measurement that calibrates the inline sensor. A dissolution test or bench NIR reading every four hours validates that the inline sensor has not drifted and confirms the blend composition at a higher accuracy level than the continuous monitor alone. Any discrepancy between inline and lab readings triggers a sensor recalibration.
Layer 4
Lot Release Composition Certificate
Frequency: Every production lot
Before a production lot is released to the winding stage, the quality system generates a composition certificate summarising the blend ratio range observed during production (mean, standard deviation, minimum, maximum), the number of control limit events, and the corrective actions taken. This document travels with the lot through downstream processing and provides the dye house with the blend history needed to adjust dye formulas if necessary.
Blend Control KPIs
Six Metrics That Define Blend Ratio Process Capability
Blend Ratio Cpk
Target: ≥1.33
Process capability index for blend ratio. Measures how well the actual ratio distribution fits within the specification tolerance band. A Cpk below 1.0 means the process is routinely producing off-ratio material. Target 1.33 provides a meaningful buffer against process drift before specification limits are reached.
Ratio Control Limit Breach Rate
Target: <2 events/shift
Count of SPC control limit breaches per shift per blend type. More than 4 events per shift indicates a systematic cause — bale lot change, differential waste change, or sensor drift. Below 2 events per shift on a mature process indicates stable blend control with only random variation.
Inline-to-Lab Agreement
Target: <±0.5%
Difference between inline sensor reading and concurrent lab analysis at each verification point. Agreement within ±0.5% confirms the inline sensor is calibrated and trustworthy. Drift beyond ±1.0% requires sensor recalibration before inline data can be used for lot release decisions.
Lot Ratio Range
Target: <±1.5%
Maximum minus minimum blend ratio reading within a single production lot. Even when the lot average is on target, a wide within-lot range means the dye house will see shade variation within the same lot — the most difficult type of variation to manage because it cannot be corrected by adjusting a single dye formula.
Card Waste Differential
Monitor monthly
Difference in waste percentage between cotton and polyester card passages. Tracked monthly and used to update the laydown calculation correction factor. A card waste differential that changes over time — due to fibre lot changes or card clothing wear — introduces systematic blend error unless the laydown formula is updated to compensate.
Moisture-Corrected Ratio Accuracy
Target: ±0.5% of nominal
Blend ratio expressed on a dry-weight basis, corrected for the moisture regain of each incoming lot. The metric that truly validates whether the fibre mass entering the process matches the specified blend — as opposed to the nominal weight-based calculation that ignores moisture variation between natural and synthetic fibre lots.
From the Blend Room
“
The hardest conversation I have in any yarn mill is explaining to production management that their blend ratio has been running at 62/38 for three months while the specification says 60/40 — and that their quality team had no way of knowing, because their only verification method was a burn test done once per day on a grab sample. The issue is not negligence. The issue is that a once-per-day check on a continuous process gives you exactly that: one data point in approximately 1,440 minutes of production. Everything that happened between those data points is invisible. Modern inline NIR systems change the equation entirely — you move from 1 data point per day to 1,440 data points per day, and the blend ratio chart becomes a genuine process control tool rather than a box-ticking exercise. I have seen mills reduce dye house lot rejections by 60 to 80 percent within a single season of deploying real-time blend monitoring. Not because the equipment or people changed. Because the information was finally available in time to act on it.
Rajan Subramaniam
Textile Process Engineer · 24 years in ring spinning and blended yarn manufacturing · Former Head of Process Technology, South Asian Composite Yarn Group · Specialist in inline quality systems for blended fibre preparation
Technical Questions
Cotton-Polyester Blend Ratio Control — Frequently Asked
How much blend ratio deviation is actually acceptable in commercial cotton-polyester yarn production?
The acceptable tolerance depends on end use and customer specification, but as a practical reference: apparel yarns destined for reactive or disperse dyeing typically require ±1.5% of the nominal ratio to avoid visible shade variation. Technical textiles and industrial yarns may accept ±3% where appearance is less critical than performance. Home textiles occupy a middle ground at ±2%. The critical point is that these tolerances apply to the true fibre composition of the yarn, not to the laydown calculation — and most mills discover that their laydown-to-yarn ratio accuracy is 2 to 4 times wider than the tolerance they are targeting. Closing that gap requires inline measurement. For a detailed conversation on tolerance specification for your specific end uses, book a session with the iFactory textile quality team.
Can NIR spectroscopy accurately distinguish between cotton and polyester in a blend at production speed?
Yes — NIR spectroscopy is the established standard for inline blend composition measurement in textile production. Cotton and polyester have distinct spectral signatures across the 900 to 2500 nanometre range: cotton shows strong absorption bands from cellulosic hydroxyl groups, while polyester shows characteristically different carbonyl and aromatic ring absorptions. On sliver or lap material running at production speeds, a properly calibrated inline NIR sensor delivers composition readings accurate to ±0.3 to 0.8% at a measurement interval of 30 to 120 seconds. The accuracy is sufficient to support SPC control charting with ±1.5% control limits. Calibration must be maintained against laboratory dissolution or burn tests at a frequency of every 4 to 8 hours, or whenever an input fibre lot changes. iFactory's integration layer connects inline NIR output directly to the real-time SPC dashboard. Reach out to our support team for integration specifications.
How should we calculate the laydown formula when cotton lots have different moisture regain values?
The laydown formula should always be calculated on a dry-weight basis, with each lot's contribution expressed as the nominal weight multiplied by a moisture correction factor of (1 − moisture regain fraction). For a cotton lot at 8.5% moisture regain, the dry-weight correction factor is 0.915; for a lot at 6.2%, the factor is 0.938. A 60/40 blend targeted on a dry-weight basis using bales from these two different cotton lots requires different nominal weight allocations to achieve the same dry-weight ratio. Most mills do not make this correction, which is why blend ratios shift systematically when cotton origin or gin method changes between supply seasons. The correction is a straightforward formula update in the blend room calculation system, and it eliminates one of the most common sources of systematic ratio error without any capital expenditure.
Where in the process is the best point to install an inline blend monitoring sensor?
The optimal installation point depends on what type of deviation you need to catch and how quickly. The blowroom output is the earliest detection point — if a bale laydown error enters the blowroom, an inline monitor here catches it before it reaches the card, limiting the volume of off-ratio material produced. The card sliver is the most common installation point because it represents the blend composition after differential opening and waste removal — the two processes that most frequently cause deviation from the laydown calculation. The draw frame output is the latest useful detection point — by this stage, doubling has averaged short-range variation, making the draw frame sliver the most representative composition sample for the yarn that will be spun. Installing at both card output and draw frame output provides the most complete coverage: card monitors detect opening-stage issues, draw frame confirms the composition delivered to spinning. Book a demonstration to see iFactory's multi-point blend monitoring configuration for your specific line layout.
What corrective actions should the blend room supervisor take when the inline monitor shows a control limit breach?
The corrective action depends on the direction of deviation and its rate of change. If the cotton proportion is rising above the upper control limit, the first check is whether the current bale layer is running heavier on cotton bales due to bale density variation — adjusting the feed apron speed or temporarily reducing cotton bale access corrects this. If the polyester proportion is rising, check whether card waste rate has changed, indicating a card clothing issue that is selectively removing more cotton short fibre than usual. If the deviation is directional and gradual, it is most likely a card waste or opening differential issue. If it is sudden, it is most likely a bale lot change or an informal laydown adjustment. All corrective actions should be logged digitally with the deviation reading, the action taken, and the result — so that pattern analysis over multiple shifts can identify whether the same correction is being applied repeatedly, which indicates a systematic cause that needs a permanent fix rather than repeated adjustment. iFactory's blend monitoring module includes a corrective action log linked to each control chart event.
Blend Ratio Is Set in the Blend Room. The Cost of Getting It Wrong Is Paid in the Dye House.
Real-Time Blend Monitoring Closes the Gap Between What You Specified and What You Produced
iFactory's blend consistency module connects to your existing inline NIR sensors, gravimetric systems, and lab data to build a continuous, lot-linked blend ratio chart with SPC control limits, corrective action logging, and automatic composition certificates at lot release. The first deployment typically reveals blend ratio variation 2 to 3 times wider than the mill's last lab-based estimate.