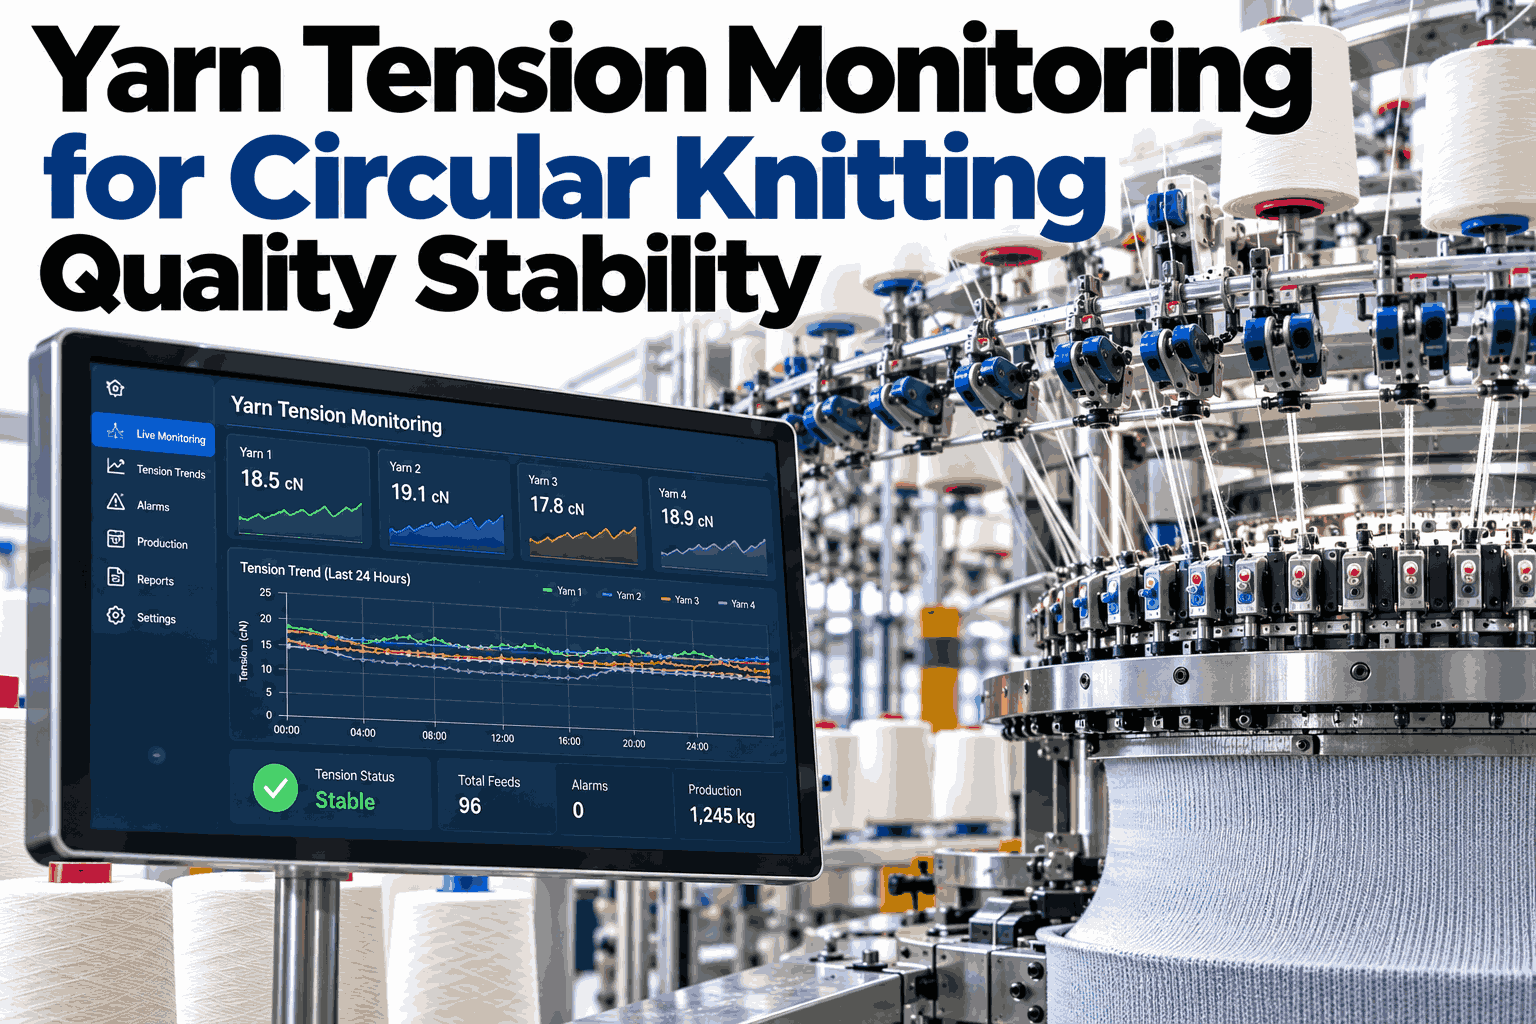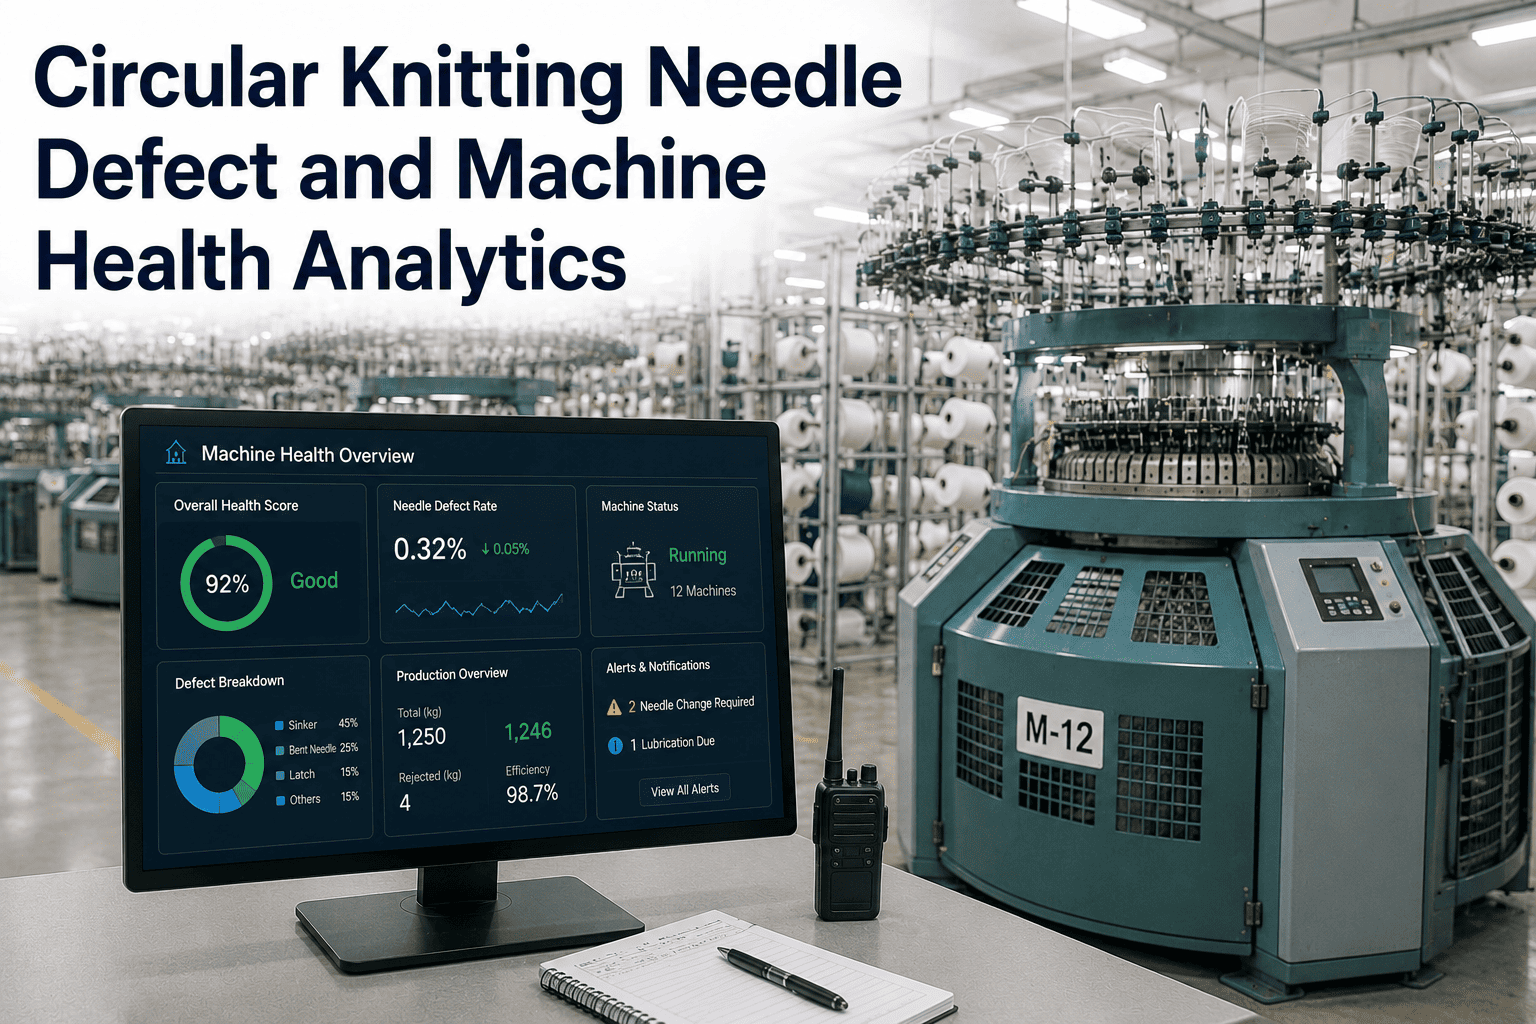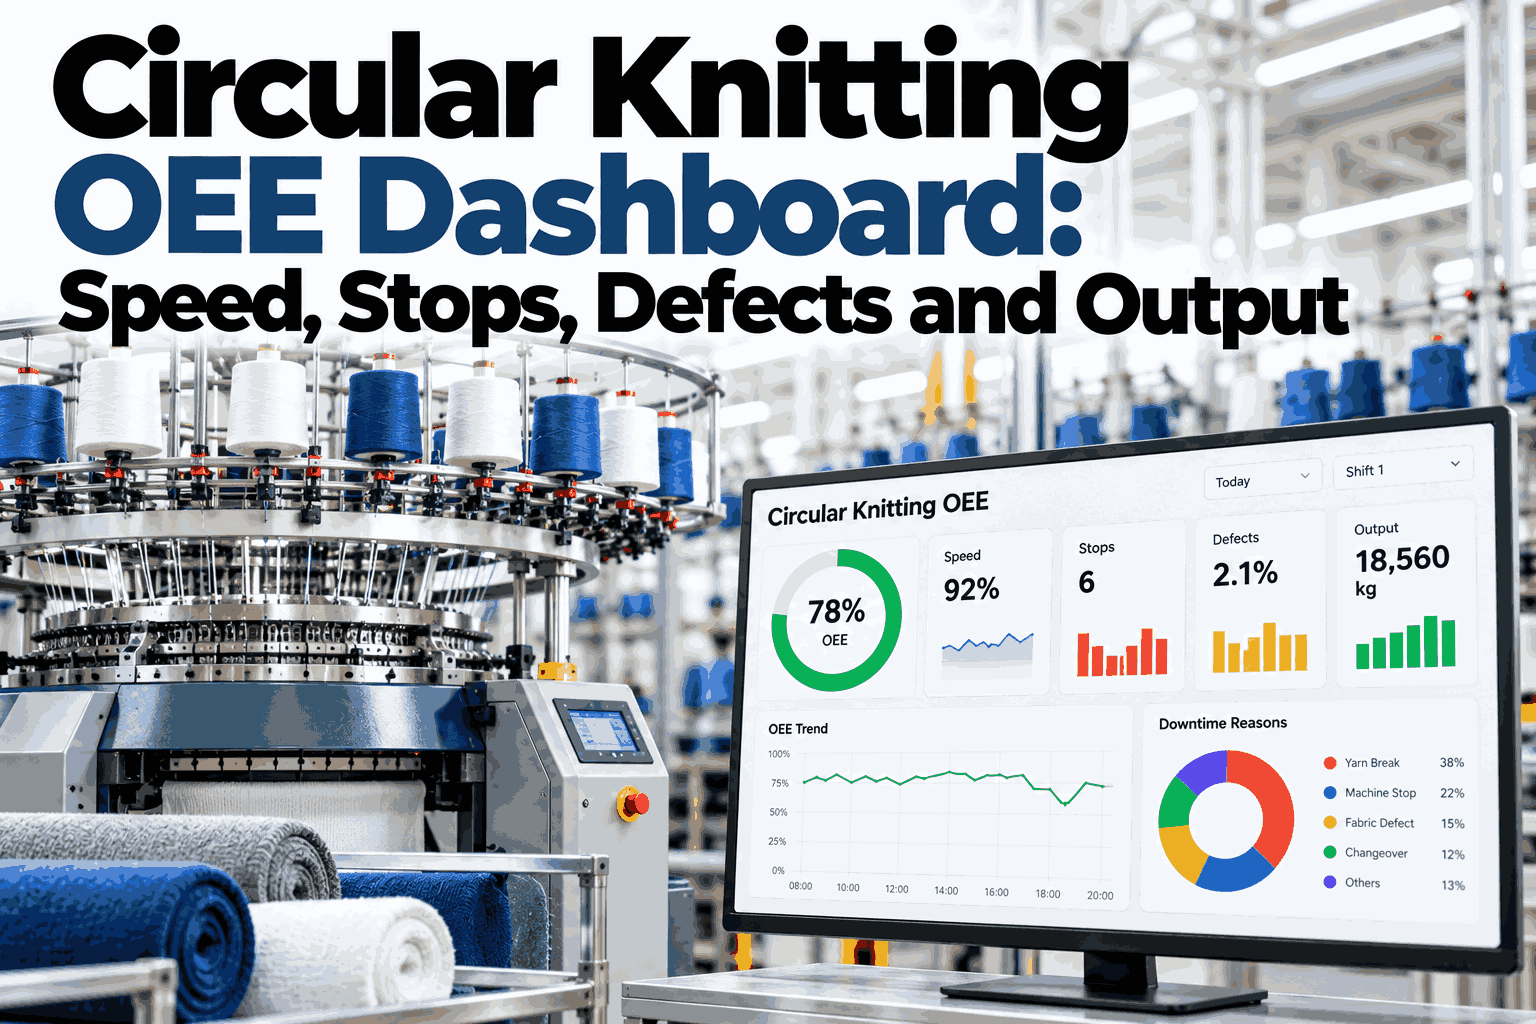
Circular knitting lines rarely stop for one dramatic reason. They lose output in small increments: a few extra seconds between yarn breaks, a feeder that stutters on a bulkier count, a needle track that never quite climbs back to rated RPM after a changeover. Added across a shift, these minutes disappear faster than any single breakdown report would suggest, and they rarely show up until the week's output falls short. Most knitting floors can already read machine speed and shift output on their own, but far fewer can see stops, defects and speed loss on the same screen, tied to the same hour and the same machine. Teams who want a working view before committing to a rollout can walk through a live knitting OEE dashboard built from one circular line.
See Speed, Stops, Defects and Output on One Knitting OEE Screen
iFactory AI pulls feeder counts, stop codes and inspection results from every circular knitting machine into a single, shift-level OEE number you can trust, broken down the moment a shift ends instead of reconstructed days later.
82%
79%
94%
1,180 kg
The ring above is built the same way a real dashboard builds it: one shared score, surrounded by the four numbers that fed into it. Nothing here is a single sensor reading. Every segment is already a comparison, rated against actual, planned against running, good against total, so a supervisor can see at a glance which pillar is pulling the shift down without opening four separate reports first.
Why Knitting OEE Hides in Plain Sight
A circular knitting machine already reports plenty of numbers. The problem is that they live in four different places and never meet.
Floors that already track output closely sometimes assume they have OEE covered. What they usually have is one pillar out of four, measured well. Speed, stop reasons and defect source still need their own data path, and all three need to line up against the same machine and the same hour before the output number actually explains itself.
The Four Pillars of a Knitting OEE Number
Each pillar answers a different question, and each one has its own blind spot when tracked by hand. Together they multiply into the single OEE figure shown on the ring above, so a weak pillar pulls the whole number down even when the other three look healthy.
| Pillar | Measures | Data Source | Common Blind Spot |
|---|---|---|---|
| Speed | Actual feeder RPM against rated RPM for the count and gauge | Machine controller or feeder sensor | Rated speed is treated as fixed, not count-specific |
| Availability | Running time against planned time | Stop and start timestamps | Short stops under two minutes go unlogged |
| Quality | Good fabric against total fabric produced | Inspection table grading | Defect is recorded, not which needle track made it |
| Output | Kilograms or metres against the shift target | Roll weighing and tally sheets | Totalled too late to act on the same shift |
Most mills already track one or two of these pillars reasonably well, usually speed and output, since both come off the machine controller or the weighing scale with little extra effort. Availability and quality tend to lag, because both depend on someone writing something down at the right moment, and that habit is the first thing to slip during a busy shift.
See Your Own Line's OEE Breakdown
Book a 30-minute session and iFactory AI will build a speed, stop, defect and output breakdown from one of your own circular knitting machines, using your own stop and inspection data rather than a generic example.
Needle Track Speed: Rated RPM Against Actual RPM
Speed loss is the quietest loss on a knitting floor, because the machine is still running and the operator is still working. The pairs below compare rated and actual RPM across six illustrative tracks on the same shift. Mills can ask support how rated speed is set per count and gauge before trusting any single number.
Speed loss like this tends to build up gradually rather than appear all at once. A worn feeder wheel, a slightly misaligned yarn guide or an operator nursing a problem count along at a cautious pace can each shave a few RPM off a track without ever tripping an alarm. None of these causes shows up on a stop report, because the machine is technically doing exactly what it was asked to do.
Where the Stops Really Come From
Availability loss is usually blamed on one or two familiar causes, often the one everyone remembers from the most recent breakdown. A full stop breakdown, counted across an entire shift instead of from memory, often tells a different story.
A single yarn break might cost a track less than a minute of running time, which is exactly why it rarely makes it onto a handwritten stop sheet. Multiply that minute by the number of breaks on a single track across an eight-hour shift, and the total often rivals or exceeds a single long breakdown that would otherwise dominate everyone's attention. A yarn break cluster on one track, repeated across several shifts, is also a useful early signal that the yarn itself or the tensioning on that feeder is worth checking before it turns into a quality problem too.
Defects by Needle Zone
A fault sheet tells you how many metres were downgraded, and sometimes which fault type it was. It rarely tells you which part of the needle cylinder caused it. The ring below groups illustrative defect density into eight needle zones around the cylinder, the same way a maintenance team would walk around the machine.
Cylinder
Low
Low
Medium
High
High
Medium
Low
Low
A fault log without a zone attached usually gets traced back to yarn quality by default, since that is the easiest explanation to reach for. Once defects are tied to a specific stretch of the cylinder instead, the same fault pattern often points somewhere far more fixable, such as a single worn needle, a dry oiling point or a sinker that needs replacing. Blaming yarn first and checking the machine last tends to waste the time of whoever reviews incoming yarn quality, while the real cause keeps producing the same fault on the next lot.
A Composite Scenario: The Changeover Habit That Was Costing a Shift
One mill's changeover process looked fine on paper. Operators followed the same steps every time, in roughly the same order, and nobody flagged it as a problem, because by every measure anyone was already checking, the line was running normally.
Once speed and stop data were lined up against the clock, the pattern became visible. After every count change, the track ran ten to fifteen minutes below rated RPM while the operator fine-tuned tension by eye, before anyone logged the machine as fully running again. None of that time appeared on a stop report, because the machine was running the whole time, just slowly, and slow running is far harder to notice than a full stop.
Who Actually Reads This Screen
The same dashboard answers a different question for each role on the floor, which is part of why it tends to get used rather than ignored after the first week.
Shift Supervisor
Checks which track is losing speed or stopping most right now, and decides where to send an operator next.
Quality Head
Reviews defect density by needle zone across the week to decide which machines need a maintenance check before the next lot.
Maintenance Lead
Uses the stop Pareto to plan preventive work around the causes actually costing the most minutes, not the ones remembered loudest.
Plant Manager
Compares OEE across machines and shifts to see whether a shortfall is a one-off or a pattern worth raising with the floor.
These four views come from the same underlying data, just filtered differently for each role. A supervisor's view updates through the shift, while a plant manager's view is usually checked once a day or once a week, but neither one requires a separate report to be built or chased down.
Benchmarking Across Machines, Not Just Across Shifts
A single shift's OEE number is useful, but it answers a narrow question. Comparing the same pillar across every machine on the floor answers a bigger one: which machines are worth investing attention in first.
Two tracks running the same count, on the same shift, with the same operator experience, can still post noticeably different OEE figures once speed, stops and defects are broken out separately. That gap is rarely explained by luck. It usually points to a specific, fixable difference between the two machines, whether that is a feeder due for service, a needle track overdue for replacement or a changeover habit that varies from one operator to the next.
Ranking machines side by side on the same four pillars turns a long list of individual numbers into a short list of where to look first, which is a far more useful starting point for a maintenance or training conversation than a single floor-wide average. Over a few weeks, the same ranking also shows whether a low-scoring machine is improving after a fix or simply drifting back down again.
A Quick Self-Check Before You Add Software
A dashboard is only as good as the questions it is built to answer, and most of that groundwork has nothing to do with software. These checks help frame what to ask for before any rollout begins, and most mills can answer them in a single conversation with the floor team.
None of these checks require new equipment to answer. They are mostly questions about habits that already exist on the floor, and the answers shape how long onboarding takes far more than the size of the fleet does.
Where iFactory AI Fits
Building a knitting OEE view by hand means someone reconciling four spreadsheets every shift, usually a supervisor who already has a full day without that task. iFactory AI connects the sources directly, so the reconciling happens automatically instead of at the end of a shift.
Feeder-Level Speed Tracking
Actual RPM compared automatically with the rated speed for the count and gauge being run, so a slow track is flagged the same shift it happens rather than discovered weeks later.
Automatic Stop Capture
Stops of any length are logged with a timestamp and matched against machine fault codes, including the short, frequent stops that a paper logbook tends to miss entirely.
Defect-to-Zone Mapping
Inspection results are linked back to the needle track and time window that produced them, turning a fault count into a specific, checkable cause.
Shift-Level OEE Roll-Up
Speed, availability and quality combine into one OEE figure per machine, per shift, visible as it happens rather than reconstructed afterward.
iFactory AI arrives pre-configured on an NVIDIA server that ships racked and ready with software pre-loaded. Rack it, connect power and Ethernet, and feeder and stop data begin flowing. Scope covers cabling, network setup, machine controller integration, operator training and 24×7 remote monitoring, so the floor team is not left to configure anything alone.
Frequently Asked Questions
A few questions come up on almost every first call with a knitting floor. The answers below cover the most common ones before a demo even starts.
Is this the same as the production counter already on the machine?
No. A production counter totals output, while an OEE dashboard explains why the total came out the way it did, by separating speed loss, stop time and quality loss. The counter stays useful as a cross-check against the dashboard's own output figure, and both numbers are shown side by side rather than one replacing the other. iFactory AI's team can walk through how the two reconcile on your own machines.
How is quality loss calculated without a camera on every needle track?
Inspection table results are linked back to the time window and track that produced the fabric, using roll and lot identifiers already recorded at grading. That link is enough to turn a fault count into a specific needle zone or machine, which is most of the value. A vision system can be added later to catch faults earlier, but it is not required to start. See how defect-to-zone mapping works in a short walkthrough.
Will this work on older mechanical machines as well as newer electronic ones?
Electronic machines with a controller feed data directly, while older mechanical machines are fitted with a feeder sensor to capture RPM and stop events. Both feed the same dashboard, so a floor with a mixed fleet still gets one comparable OEE view across every machine rather than two separate systems to reconcile by hand. Rated speed tables are set up individually for each machine type during onboarding.
How long before the dashboard numbers can be trusted?
Rated speeds and stop codes are validated against a few weeks of running counts before the OEE figure is treated as final. Lines with stable, well-documented counts validate fastest, while floors running many short lots need a longer settling period before the numbers are used for decisions. Supervisors can still watch live speed and stop data from day one, well before the full OEE figure is considered fully trustworthy.
How does this connect to the kg per hour figures costing already tracks?
The dashboard's output figure is built from the same weighing and tally data costing already uses, so the two should match closely once validated. The difference is that OEE also shows why output fell short on a given shift, by breaking the shortfall down into speed, stop and quality loss instead of leaving it as a single unexplained number. Ask support how OEE output rolls into existing efficiency benchmarks for your mill.
Put Speed, Stops, Defects and Output on One Screen
iFactory AI turns feeder data, stop codes and inspection results from your circular knitting machines into one live OEE view, by machine, by shift, so speed loss, stops and defects stop competing for blame. Book a walkthrough on your own floor data.