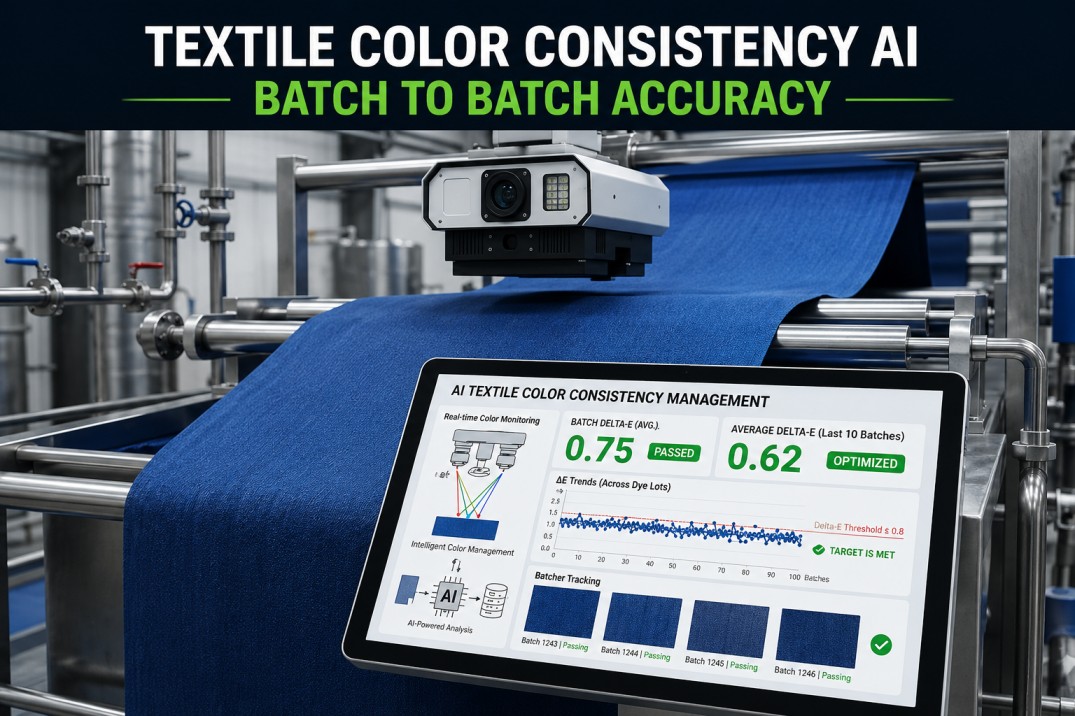
A dyed fabric batch can look perfectly matched under the fluorescent lights of a production floor and fail outright under the daylight bulb in a buyer's approval room — this is metamerism, and it is one of the most common reasons a shade that passed internal inspection still comes back rejected. Color measurement removes the guesswork by converting what the human eye perceives into numbers: CIE L*a*b* coordinates and a Delta E value that quantifies exactly how far a sample sits from the approved standard, under any lighting condition the buyer specifies. iFactory connects spectrophotometer readings directly into a shared approval workflow so shade decisions stop depending on which light box someone happened to use.
Color Measurement: From Spectrophotometer Reading to Buyer Approval
CIE L*a*b* color space and Delta E tolerance turn subjective shade judgment into a repeatable, defensible number that both mill and buyer can agree on before goods ship.
Understanding CIE L*a*b*: The Three Coordinates Behind Every Shade Decision
Every color a spectrophotometer measures gets expressed as three coordinates in CIE L*a*b* space. Understanding what each axis represents makes it far easier to interpret why a batch failed and which direction the correction needs to move in.
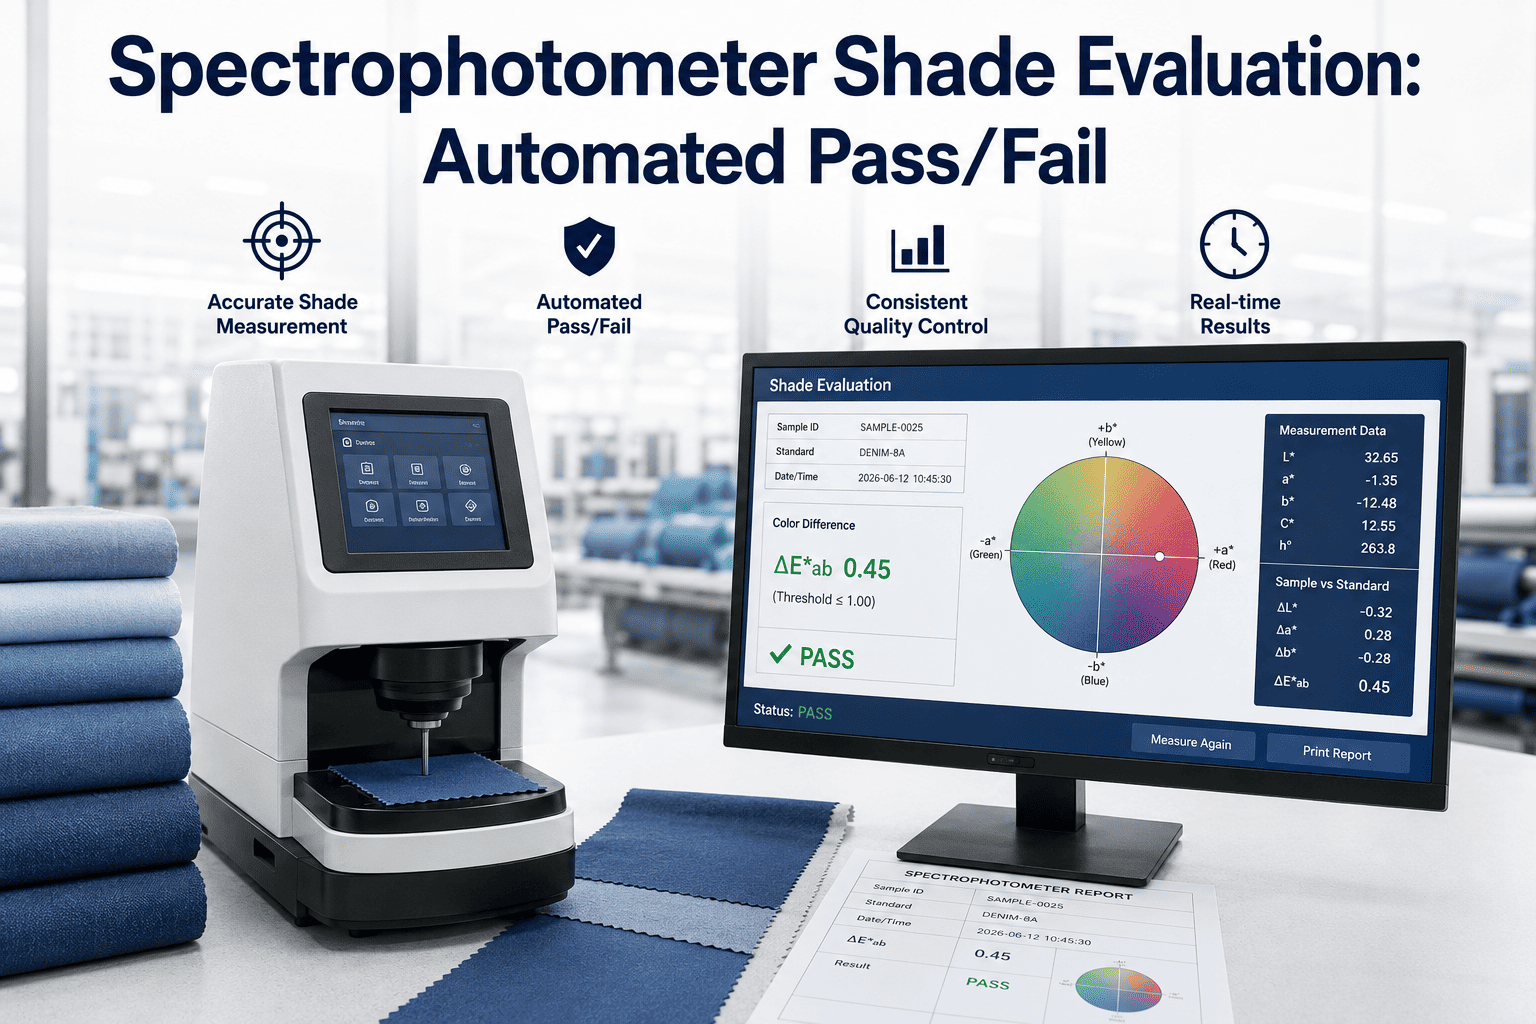
Delta E: Converting Three Numbers Into One Pass or Fail Decision
Delta E is the total distance between a sample's L*a*b* coordinates and the approved standard's coordinates, combined into a single value. Most buyers set an approval tolerance, commonly in a tight range for critical shades and a looser range for less visually sensitive ones, and any batch measuring above that tolerance is rejected regardless of how the fabric looks under a particular light.
Metamerism: Why the Same Fabric Can Pass and Fail on the Same Day
Two fabric samples can share an identical Delta E value under one light source and diverge visibly under another if their spectral reflectance curves differ even though their measured color coordinates match. This is metamerism, and it is precisely why buyers specify multiple illuminants — typically standard daylight, store fluorescent lighting, and incandescent — for shade approval rather than relying on a single light condition.
iFactory pulls spectrophotometer readings directly into a shared dashboard so mill and buyer teams review the same Delta E data, under the same illuminants, without re-measuring or re-arguing shade decisions.
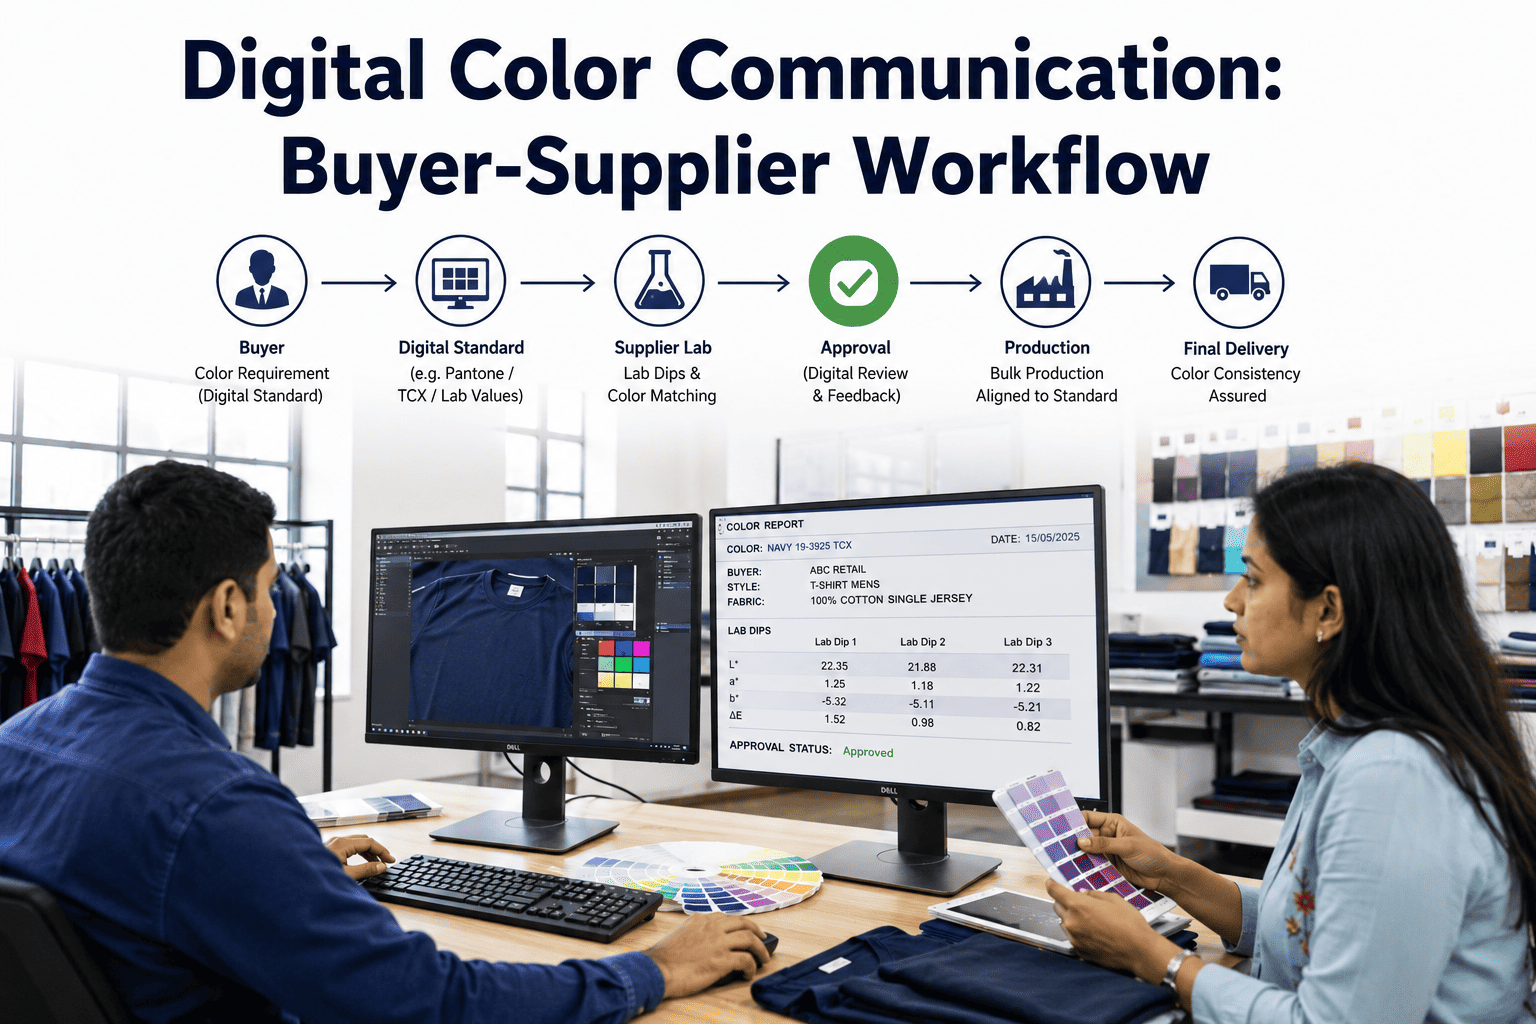
The Color Approval Workflow: From Lab Dip to Bulk Production Sign-Off
Color approval moves through several checkpoints before a shade is cleared for bulk dyeing, and skipping or rushing any one of them is a common source of late-stage rejections that are expensive to correct once fabric is already dyed in bulk quantity.
Common Color Measurement Mistakes That Lead to Buyer Rejections
Instrument Calibration: The Foundation Every Reading Depends On
A spectrophotometer that hasn't been calibrated recently can produce readings that look entirely plausible while being systematically off, and because the error is consistent rather than random, it can go unnoticed for a surprisingly long time. Calibration against certified white and black reference tiles resets the instrument's baseline, correcting for drift caused by lamp aging, optical component degradation, or accumulated dust on the measurement aperture. Most manufacturers recommend calibration at the start of each shift or measurement session, and mills running high volumes of shade approvals daily often calibrate more frequently than that minimum recommendation simply because the cost of a single mis-calibrated session propagating through dozens of approvals is far higher than the few minutes calibration takes.
Beyond routine calibration, periodic verification against a certified independent standard — separate from the instrument's own built-in reference tiles — catches a subtler failure mode where the instrument's internal calibration reference itself has degraded. This is less common but not rare enough to ignore, particularly for reference tiles that have seen years of handling and light exposure. Mills that maintain a documented calibration schedule, with results logged and trended over time rather than simply performed and forgotten, are able to catch a slowly drifting instrument well before it starts generating disputed Delta E values with buyers.
Building a Color Data Library: Turning Historical Approvals Into a Competitive Advantage
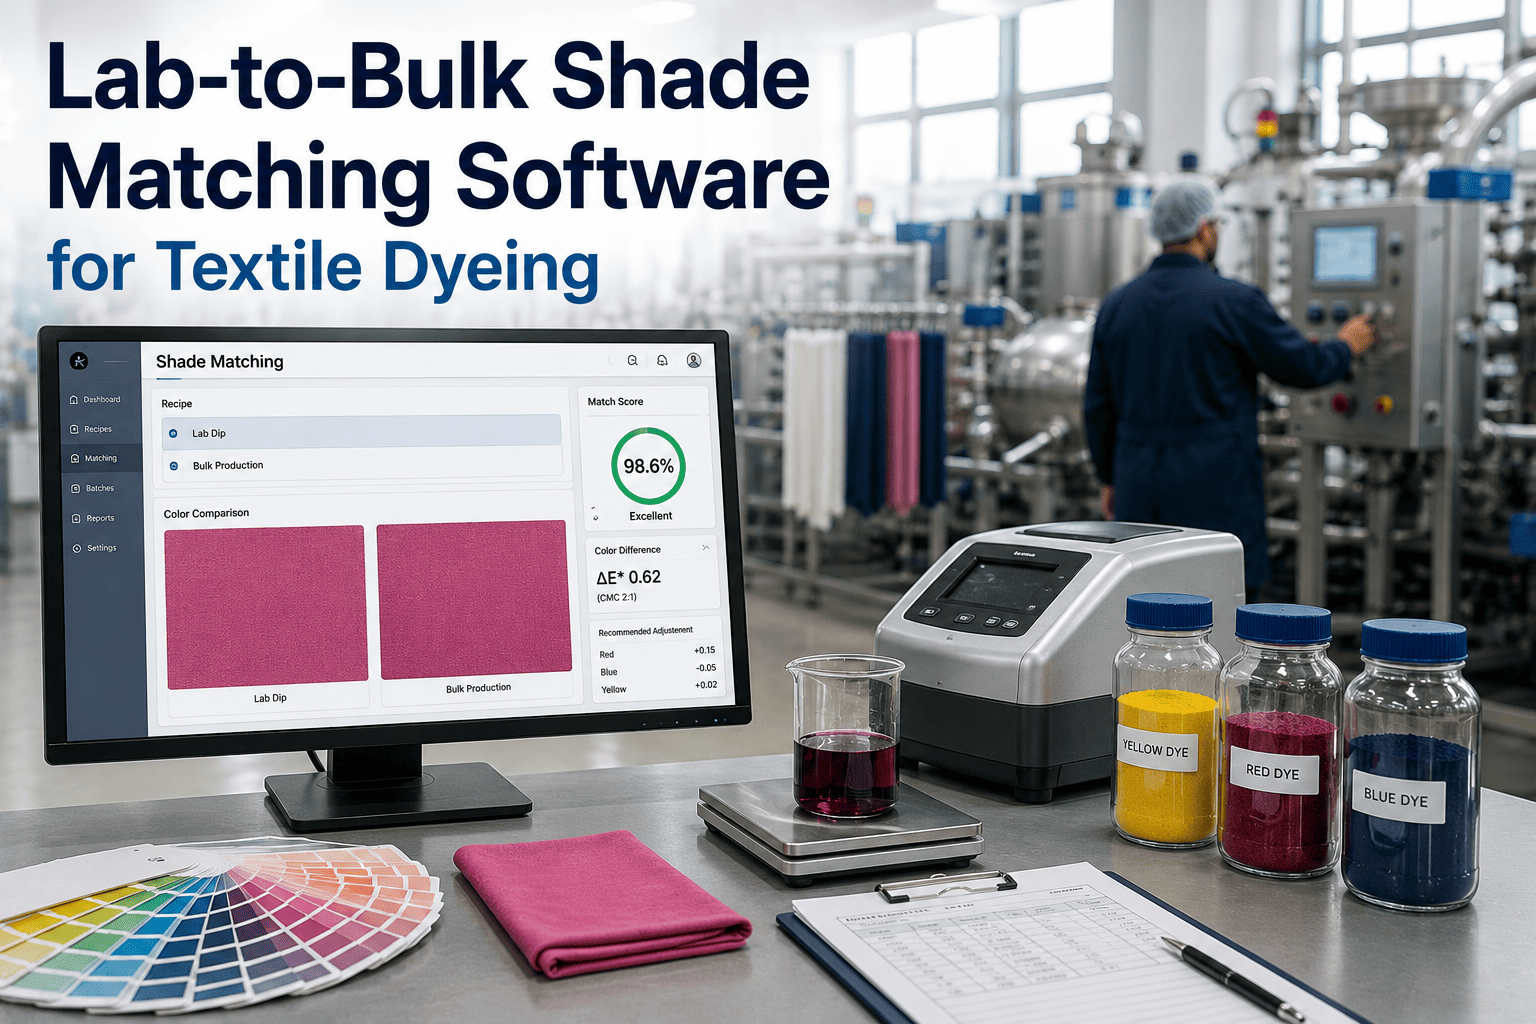
Every approved lab dip and every rejected shade represents a data point, and mills that systematically retain this data build something considerably more valuable than a simple approval archive — a searchable reference library that speeds up future color matching. When a new order calls for a shade similar to something previously approved, having instant access to the exact L*a*b* coordinates, the dye recipe that achieved them, and the specific fabric substrate involved can cut lab dip iteration significantly compared to starting the matching process from scratch.
This library becomes even more valuable when it's connected to outcome data — which recipes reached first-time approval versus which required multiple correction rounds, and which specific dye combinations tend to show metamerism problems under particular illuminant combinations. Over time, this turns color matching from an individually-held skill residing in one colorist's experience into an organizational capability that survives staff turnover and scales across multiple dye house locations. Mills that have invested in this kind of structured color data consistently report faster lab dip turnaround and fewer repeat approval rounds with recurring buyer accounts.
Color Approval Disputes: How Objective Data Resolves Disagreements Faster
Even with instrument-based measurement, color approval disputes between mill and buyer still happen, usually stemming from disagreement over which illuminant should govern approval, differences in how each party's instrument was calibrated, or genuine borderline cases sitting right at the edge of the agreed tolerance. The mills that resolve these disputes fastest are the ones who can immediately produce the full measurement record — every illuminant tested, the calibration timestamp for the instrument used, and the specific Delta E value calculated against the correct standard — rather than needing to re-measure and re-submit before the conversation can even begin.
This immediacy matters commercially as much as technically. A shade dispute that takes a week to resolve because data needs to be gathered, re-tested, and re-submitted can delay an entire shipment, while the same dispute resolved within hours because the data was already logged and shareable keeps production moving. Buyers increasingly favor mills that can provide this kind of transparent, real-time data access, viewing it as a signal of process maturity that reduces their own supply chain risk.
Fabric-Specific Measurement Challenges: Why Texture and Construction Complicate Color Reading
Flat, smooth fabric samples measure consistently and predictably, but real production fabric rarely comes in that ideal form. Textured weaves, pile fabrics, and heavily structured knits scatter light differently across their surface than a flat swatch does, which means the same dye recipe can produce measurably different spectrophotometer readings depending on which specific point on a textured surface the instrument aperture lands on. This is why standard measurement protocols call for multiple readings averaged across different points on a single sample rather than relying on one measurement, since a single reading on a textured fabric risks capturing an unrepresentative point rather than the fabric's true overall shade.
Fabric weight and opacity introduce a related complication. Lightweight or semi-sheer fabrics can allow some light to pass through and reflect off whatever backing material sits behind the sample during measurement, subtly distorting the reading unless a standardized, non-reflective backing is used consistently across every measurement. Mills that skip this standardization step sometimes find their internal readings don't match a buyer's independent lab results, not because either measurement was performed incorrectly, but because the backing conditions differed between the two measurement setups. Establishing and documenting a consistent measurement protocol — sample folding, backing material, aperture size, and number of averaged readings — removes this entire category of avoidable discrepancy before it becomes a dispute.
Remote Color Approval: Managing Shade Sign-Off Across Global Supply Chains
Modern apparel supply chains routinely involve a mill in one country, a buyer's design team in another, and a merchandising office in a third, all needing to agree on the same shade before bulk production begins. Physical swatches mailed between these locations remain common practice in some segments of the industry, but the shipping time alone can add days or weeks to an approval cycle that a digital data exchange would compress to hours. The instrument data itself — L*a*b* coordinates, Delta E against standard, and the illuminants tested — travels instantly regardless of geography, and the only reason physical swatches remain necessary in many workflows is that not every party trusts a shared digital record as much as they trust seeing and touching the actual fabric.
Building that trust requires consistent, verifiable data practices on the mill side. A buyer who has seen a mill's spectrophotometer data align reliably with physical swatch outcomes over multiple orders becomes progressively more comfortable relying on digital approval for routine reorders, reserving physical swatch review for genuinely new colors or higher-risk product categories. This shift doesn't happen from a single successful digital approval — it builds cumulatively from a track record, which is exactly why maintaining a consistent, well-documented measurement practice pays dividends well beyond the immediate order it was performed for.
Training Colorists to Work With Instrument Data Rather Than Around It
Experienced colorists sometimes develop a degree of skepticism toward instrument readings, particularly when early exposure to spectrophotometer measurement came from poorly calibrated or inconsistently operated equipment that produced results conflicting with their trained visual judgment. This skepticism, while understandable given that history, becomes counterproductive once an instrument is properly calibrated and operated to protocol, since it can lead colorists to override valid instrument data based on visual impression alone, reintroducing exactly the subjectivity that instrument measurement was adopted to eliminate.
The most effective training approach treats instrument data and visual judgment as complementary rather than competing sources of truth. Colorists learn to trust the Delta E number as the primary approval criterion while still using visual inspection to catch the rarer cases where instrument averaging might smooth over a defect the eye would catch, such as localized shade streaks that a single averaged reading wouldn't reveal. This combined approach, built on genuine understanding of what each method catches and misses, produces more reliable approval decisions than either method used in isolation, and it's a training investment that pays off across every future shade decision the colorist makes.
Frequently Asked Questions
iFactory connects your spectrophotometer readings into one dashboard your team and your buyers can both trust, cutting approval cycles and reducing repeat rejections.