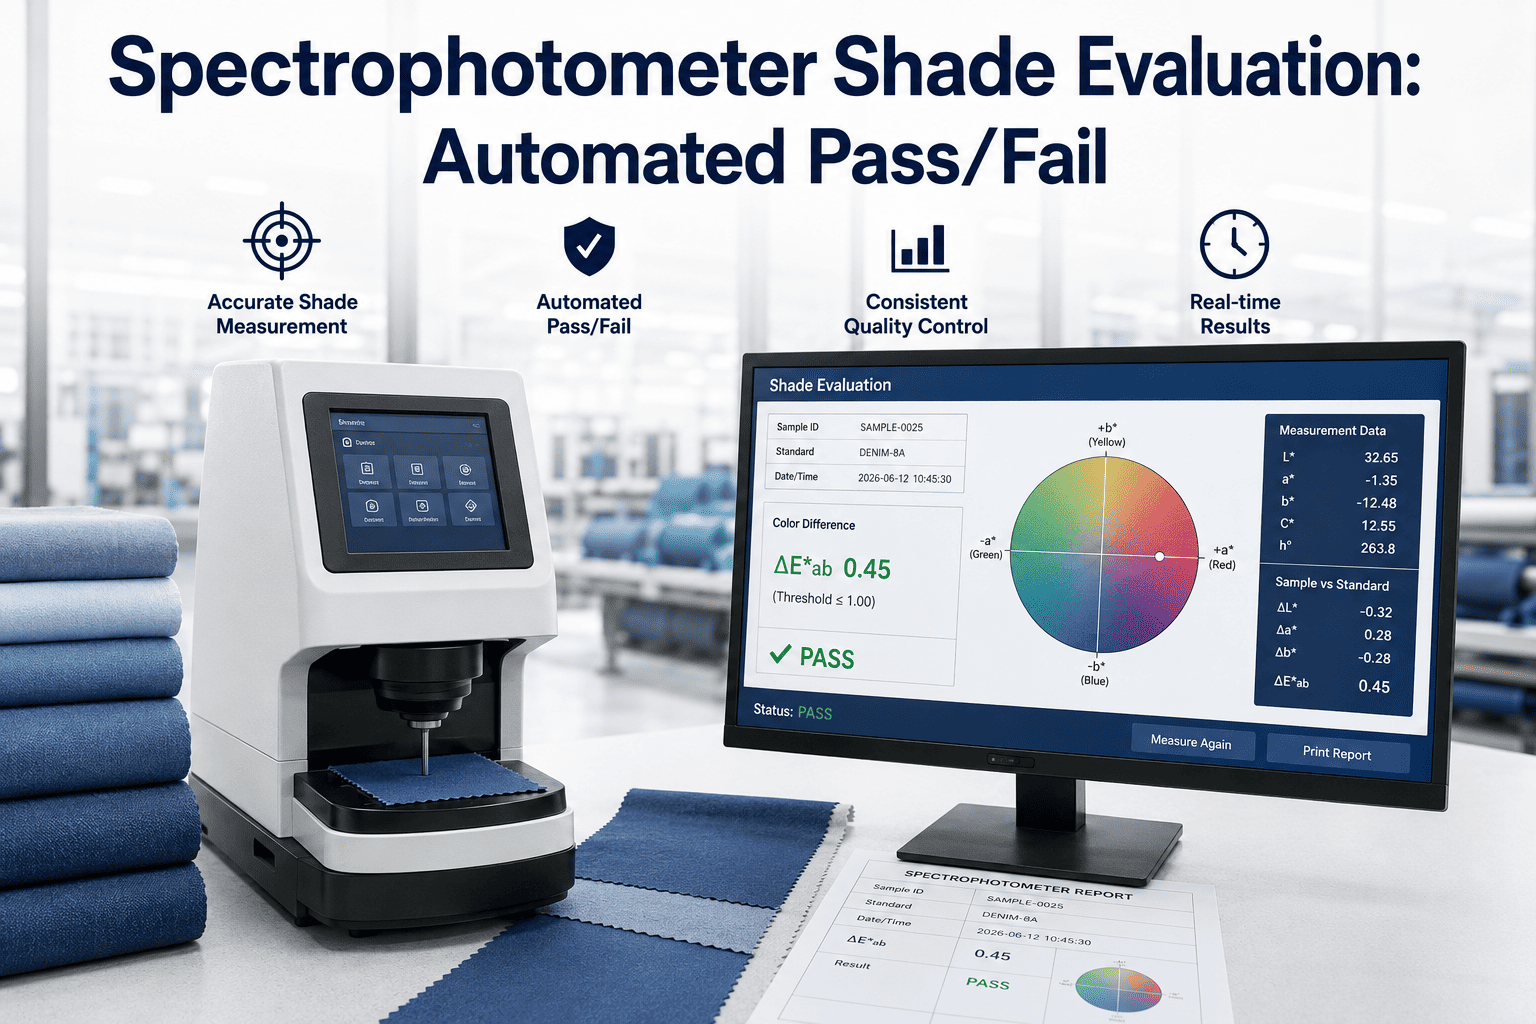
A spectrophotometer sitting on a laboratory bench connected to nothing but a printer is a measurement instrument. A spectrophotometer connected to a tolerance database, a ΔE calculation engine, a pass/fail decision rule set, and a workflow routing system is a quality control system. Most dye houses have the first. The difference between the two is not hardware — it is the automation layer that converts a reflectance curve into a documented, defensible, instantly routable pass or fail decision without a technician having to look at a tolerance card, consult a visual reference, or make a judgment call under D65 illumination at 4:30 PM on a Friday afternoon. The variability in that judgment call — across observers, across shifts, across fatigue levels and experience — is one of the most consistent sources of shade quality failure in the textile and apparel supply chain. Book a demonstration of iFactory's spectrophotometer integration and automated shade approval workflow.
Dye Recipe Quality · Color Science · Lab Automation
Spectrophotometer Shade Evaluation: Automated ΔE Calculation, Tolerance Mapping, and Pass/Fail Decisions at Scale
A color laboratory reference for dye house managers, lab technicians, and quality engineers implementing automated shade approval — from spectrophotometer integration through ΔE calculation, tolerance setting, metamerism detection, and workflow routing to customer sign-off.
ΔE 0.5–1.8
Observer-to-observer visual shade assessment variability under standardised conditions
3–6×
Higher shade re-submission rate in labs using visual assessment vs. automated ΔE
<8 sec
Time from spectrophotometer reading to automated pass/fail decision in integrated systems
100%
Audit trail coverage when every shade decision is linked to a spectrophotometer reading
Why Human Shade Judgment Is a Quality Risk, Not a Quality Control
Visual shade assessment is a trained skill that is also an inherently variable one. Even trained colorists working under standardised D65 illumination in a controlled light booth produce inter-observer ΔE agreement of only ±0.8 to 1.8 units on complex chromatic samples. This variability is not eliminated by experience — it is a fundamental property of the human visual system, which processes colour through three cone types that vary in spectral sensitivity between individuals and degrade with fatigue and age. When the shade evaluation system relies on this variability as its primary decision mechanism, the pass/fail outcome of any individual shade submission is partly a function of who evaluated it and when.
Observer Variability
The same shade evaluated by two colorists under identical conditions will produce different pass/fail outcomes when the sample falls near the tolerance boundary. Studies consistently show inter-observer agreement breaks down at ΔE values between 0.8 and 1.5 — exactly the range where most commercial tolerance limits are set.
Metamerism Blindness
A shade that matches under D65 illumination may fail under A (tungsten) or F2 (cool fluorescent) light. Visual assessment under a single illuminant misses metamerism entirely. Automated systems evaluate the same sample under multiple illuminants simultaneously and flag metamerism index as part of every pass/fail report.
No Audit Trail
A visual assessment produces no retrievable data. When a customer disputes a shade six weeks after delivery, the dye house cannot demonstrate that the shade was evaluated against the correct standard, under the correct illuminant, by a qualified observer. An automated system creates a timestamped, observer-independent record for every decision.
Decision Delay
Manual shade assessment requires a qualified colorist to be available, the correct standard to be retrieved, the light booth to be unoccupied, and the assessment form to be completed and filed. In a busy dye house, this process takes 15 to 45 minutes per lot. Automated assessment delivers a documented decision in under 8 seconds.
The Measurement Foundation
ΔE Formulae, Tolerance Geometry, and Why the Formula Choice Matters
Delta E (ΔE) is the numeric expression of colour difference between a standard and a batch sample in the CIELAB colour space. The value represents a distance in three-dimensional colour space — but which distance formula to apply determines how well the calculated number correlates with human visual perception, which is non-uniform across the colour space.
Application Type
Recommended Formula
Typical Pass Tolerance
Review Band
Auto-Fail Threshold
Fashion / Apparel (critical shades)
CIEDE2000
ΔE00 ≤ 0.8
0.8 – 1.2
> 1.2
Home Textiles
CIEDE2000 / CMC
ΔE ≤ 1.0
1.0 – 1.5
> 1.5
Sports / Performance Wear
CMC (2:1)
ΔE ≤ 1.2
1.2 – 1.8
> 1.8
Industrial / Technical Textiles
CIE94
ΔE ≤ 2.0
2.0 – 3.0
> 3.0
Automotive Interior Trim
CIEDE2000
ΔE00 ≤ 0.5
0.5 – 0.8
> 0.8
The Automation Pipeline
From Spectrophotometer Reading to Routed Decision — Eight Steps in Under 10 Seconds
Automated shade evaluation is a sequential data pipeline, not a single software function. Each step transforms the raw reflectance measurement into progressively more actionable information. Understanding the pipeline structure is what allows dye house teams to configure it correctly for their specific tolerance standards, customer requirements, and workflow routing rules.
01
Reflectance Measurement
The spectrophotometer measures the spectral reflectance of the batch sample at wavelength intervals of 10 nm or 20 nm across the visible spectrum (400–700 nm). The measurement geometry — d/8° (diffuse/8 degree), 45/0°, or 0/45° — must match the geometry used to create the stored standard. Geometry mismatch is a common source of systematic ΔE error that has nothing to do with the actual shade difference.
02–03
XYZ Conversion and CIELAB Calculation
The reflectance curve is converted to CIE XYZ tristimulus values using the selected illuminant (D65, A, F2, etc.) and the CIE 2° or 10° standard observer function. XYZ is then converted to CIELAB (L*, a*, b*) coordinates using the standard non-linear transformation. This two-step calculation is performed for the batch and for the stored standard, producing two sets of Lab coordinates whose difference will be used in the ΔE formula.
04
ΔE Calculation Against Stored Standard
The ΔE formula specified for this customer, shade family, or substrate type is applied to the Lab coordinate pair. The system stores the formula setting per shade standard — so a critical fashion customer's standards use CIEDE2000 while a packaging customer's standards use CIE94 — without manual formula switching by the technician. The result is a single scalar ΔE value plus the component differences: ΔL*, Δa*, Δb*, ΔC* (chroma), and ΔH* (hue) for diagnostic use.
05
Metamerism Index Calculation
The full pipeline calculates ΔE under each of the specified illuminants (typically D65, Illuminant A, and F2 at minimum) and computes the Metamerism Index — the difference in ΔE between illuminants. A low MI (below 0.8) indicates the shade relationship is illuminant-stable. A high MI (above 1.5) indicates the batch and standard are matched under the evaluation illuminant but will diverge under retail or home lighting — a defect that visual assessment under a single light source will always miss.
06–07
Tolerance Map Lookup and Pass/Fail Decision
The calculated ΔE and MI are compared against the tolerance values stored for this specific combination of customer, shade, and substrate. The tolerance map may specify different thresholds for different hue angles — tighter tolerance in the blue-green region, looser in the yellow-orange — reflecting the known non-uniformity of human colour perception. The system applies the correct tolerance record automatically based on the shade standard selected at the start of the measurement session.
08
Workflow Routing and Documentation
Pass results trigger automatic lot release notification to the finishing department. Review results route to the senior colorist queue with the full measurement report pre-attached. Fail results generate a corrective action request to the dye room with the ΔL*, Δa*, Δb* values displayed as a correction direction — lighter/darker, redder/greener, bluer/yellower — giving the dye room technician an actionable correction target, not just a rejection notice.
Connect Your Spectrophotometer to Your Quality Workflow
iFactory Integrates with Datacolor, X-Rite, and HunterLab Instruments to Automate Every Pass/Fail Decision
Most dye houses already own the spectrophotometer. What they lack is the integration layer that converts measurement data into documented, routed, audit-ready pass/fail decisions linked to the correct customer tolerance standard. iFactory provides that layer — connecting your instrument to your QMS, MES, and dye room workflow without replacing any existing hardware.
Setting Tolerances That Are Commercially Defensible and Technically Accurate
Tolerance setting is the configuration decision that most directly determines how well the automated system serves both quality assurance and commercial relationships. Tolerances set too tight produce unnecessary re-submissions and slow throughput. Tolerances set too loose approve shades that customers will query on receipt. The correct tolerance is the tightest limit the process can reliably achieve — not the widest limit the customer will accept.
Customer-Specific Tolerances
Each customer relationship may carry different tolerance requirements. A fast-fashion retailer may specify ΔE00 ≤ 1.0 while an automotive OEM specifies ΔE00 ≤ 0.5 for the same hue angle. iFactory stores per-customer tolerance profiles that are automatically selected when a standard is called from that customer's record — no manual lookup, no risk of applying the wrong tolerance to a high-specification customer's submission.
Hue-Angle-Dependent Tolerances
Human visual sensitivity to colour difference is not uniform across hue angles. Blue-green regions require tighter tolerances (ΔE ≤ 0.8) than yellow-orange regions (ΔE ≤ 1.2) to achieve equivalent perceived colour match quality. Advanced tolerance configurations use elliptical tolerance limits that are wider in the less-sensitive hue directions — matching the actual behaviour of human perception rather than applying a uniform sphere that over-penalises some shades and under-protects others.
Substrate-Adjusted Tolerances
Cotton, polyester, nylon, and wool respond differently to the same dye concentration, producing different reflectance curve shapes even at the same nominal shade. Tolerance values calibrated for cotton cannot be applied unchanged to polyester substrates without introducing systematic approval bias. Substrate-specific tolerance records ensure the pass/fail threshold reflects what the substrate can actually achieve, not what a different material was tested against.
Metamerism Tolerance
A separate metamerism tolerance threshold — typically MI ≤ 0.8 for critical applications — is applied alongside the ΔE tolerance. A shade that passes the ΔE criterion under D65 but carries an MI above threshold is automatically flagged for review even if it would otherwise pass. This prevents the shipment of metameric matches that will appear acceptable in the laboratory under D65 illumination but will show visible shade difference under the retail or home light sources the end consumer will actually use.
Workflow Routing
What Happens After the Pass/Fail Decision — Three Routing Paths
PASS
ΔE ≤ Pass Threshold + MI ≤ Limit
Lot release notification sent to finishing / winding department
Shade certificate generated and attached to production lot record
Full measurement report archived with timestamp and standard reference
Customer portal updated if portal-integrated approval workflow active
REVIEW
ΔE in Review Band or MI Flagged
Senior colorist notified with full ΔE, MI, and component breakdown
Visual assessment requested under standardised illuminant conditions
Customer conditional approval request generated if within commercial tolerance
Outcome of review logged against the spectrophotometer record for calibration learning
FAIL
ΔE > Fail Threshold
Corrective action request sent to dye room with ΔL*, Δa*, Δb* correction direction
Lot placed on hold — no release possible without re-measurement and new pass decision
Failure reason code automatically populated from ΔE component analysis
Re-submission counter tracked per lot — lots with 3+ failures flagged for recipe review
Performance Metrics
Six KPIs That Define Shade Evaluation System Quality
First Submission Pass Rate
Target: >85%
Percentage of lot shade submissions that pass on the first measurement without any rework or recipe adjustment. The primary productivity KPI for the dye house — each re-submission consumes 4 to 12 hours of machine time. Industry average is 65–72%; automated systems routinely achieve 82–90% by providing dye room correction direction from failed submissions.
Measurement-to-Decision Time
Target: <10 seconds
Elapsed time from spectrophotometer trigger to documented pass/fail decision in the quality system. Manual assessment typically takes 15 to 45 minutes including retrieval of standard, light booth evaluation, and form completion. Automated systems achieve sub-10-second decisions, dramatically reducing the time dyed lots spend waiting for shade approval before they can move to the next process stage.
Customer Shade Dispute Rate
Target: <0.5%
Percentage of shipped lots that generate a customer shade query or complaint. The ultimate output metric of the shade evaluation system. An automated system with full measurement records eliminates the ambiguity in disputes — the dye house can demonstrate the exact ΔE at time of release and the tolerance applied, transforming a subjective disagreement into an objective measurement record.
Metamerism Flag Rate
Monitor weekly
Percentage of passed lots that carry a metamerism index above the threshold for secondary illuminant review. A rising metamerism flag rate indicates a dye recipe portfolio drift — likely a change in dye batch, auxiliary chemical, or substrate that is producing a higher proportion of metameric matches. The metric is invisible without multi-illuminant measurement in the evaluation pipeline.
Tolerance Utilisation Rate
Target: 60–80%
Average ΔE of passed lots expressed as a percentage of the tolerance limit. Consistently near 100% utilisation indicates the process is routinely operating at the boundary of commercial acceptability — a recipe or process control improvement is warranted. Consistently below 50% indicates the process is achieving better quality than the tolerance requires, and tolerance tightening may be possible.
Standard Validity Rate
Target: 100%
Percentage of shade evaluations performed against a currently valid, re-measured standard rather than an aged or expired one. Stored physical standards fade over time. Digital standards stored as reflectance curves never fade — but they must be re-validated when the measurement instrument is recalibrated or when a new instrument is introduced. An expired standard produces systematic ΔE errors that appear as process drift when the problem is actually measurement reference drift.
From the Color Laboratory
“
The most consequential thing that happens when you automate shade evaluation is not that you get faster decisions — although you do. It is that you stop making different decisions on the same shade. In a manual system, a shade at ΔE 1.1 against a 1.0 tolerance might pass on Monday morning with a rested colorist under calibrated D65 and fail on Thursday afternoon with a fatigued one under a light booth that has been on for six hours. The shade has not changed. The decision system has changed. When you remove human variability from the binary pass/fail outcome, the entire supply chain becomes more predictable — the dye house resubmission rate falls, the finishing department planning becomes more reliable, and the number of shipments that generate customer shade queries drops significantly. I have seen automated shade evaluation implemented in twelve dye houses across three continents. The first submission pass rate improves in every single case. The customer dispute rate falls in every single case. The only question is how long it takes to configure the tolerance mapping correctly for each customer — and that is a configuration challenge, not a technology challenge.
Dr. Fiona Adeyemi-Walsh
Colour Science Consultant · PhD Colour Science, University of Leeds · 19 years in textile and apparel colour quality systems · Former Head of Colour Technology, European Dyestuffs Group · Specialist in spectrophotometric shade evaluation and colour tolerance standardisation
Which ΔE formula should we use for automated shade evaluation — CIE76, CIE94, CMC, or CIEDE2000?
CIEDE2000 is the current international standard for textile shade evaluation under ISO 105-J03 and is the recommended formula for any new automated system implementation. Its principal advantage over earlier formulae is its superior perceptual uniformity — the calculated ΔE values correlate much more closely with what trained observers actually perceive across the full range of hues, lightness levels, and chroma values relevant to textile and apparel production. CIE76 is still widely supported in legacy systems but produces significant errors in the blue-green and high-chroma regions where human perception is most sensitive. CMC (2:1) remains popular for textile applications particularly in the UK and is a reasonable alternative where existing customer tolerance data is specified in CMC terms. The important rule is to match the formula to how the tolerance value was originally defined — a tolerance of ΔE00 = 1.0 is not the same pass/fail result as ΔE76 = 1.0, and mixing formulae is one of the most common sources of systemic approval error. For guidance on formula selection for your specific customer base and shade portfolio, book a tolerance configuration session with the iFactory color analytics team.
How do we handle shade evaluation for metameric pairs where the batch matches under D65 but not under other illuminants?
Metamerism is detected by calculating ΔE under each evaluation illuminant separately and comparing the results. A sample that shows ΔE 0.7 under D65 but ΔE 1.8 under Illuminant A (tungsten) has a Metamerism Index of approximately 1.1 — high enough to produce visible shade variation in retail or home environments even though it passes a D65-only evaluation. The automated pipeline calculates MI as part of every shade evaluation and applies a separate MI tolerance threshold alongside the primary ΔE tolerance. Lots that pass the ΔE threshold but exceed the MI threshold are routed to the review queue rather than being auto-released — giving the senior colorist the option to conditionally approve with customer notification or to request a recipe reformulation using better-matched dye combinations. The corrective action for high metamerism is a recipe rebuild using dyes with more similar spectral absorption curves rather than simply a strength or shade adjustment. iFactory's system flags the MI value prominently in the failed submission report to support this decision. Contact our support team for metamerism tolerance configuration guidance.
What is the correct procedure for creating and validating a stored digital shade standard?
A stored digital standard is created by averaging a minimum of 5 measurements on the physical standard sample — taken from different areas and with sample rotation between readings — to reduce the influence of surface texture, fluorescence, and fibre orientation on the reading. The averaged reflectance curve is stored with its creation date, instrument identification, calibration status at time of measurement, measurement geometry, and the identity of the technician who performed the standardisation. Validation of a stored standard should be performed whenever the spectrophotometer is recalibrated, whenever a new instrument is introduced to the laboratory, and at a minimum every 12 months for standards in active use. The validation procedure remeasures a reference physical standard under the same conditions and compares the new reading to the stored curve — if the ΔE between stored and remeasured curves exceeds 0.3, the standard requires re-creation. iFactory's standard management module tracks validation status and generates alerts when standards approach expiry or when instrument recalibration events require re-validation.
Can the automated pass/fail system be configured to send shade approval directly to our customers without manual intervention?
Yes, for lots that achieve a clean pass — ΔE below threshold and MI within limits — direct customer notification is both technically feasible and commercially common in modern dye house operations. The notification typically includes the shade name, lot number, ΔE value, measurement conditions (illuminant, formula, geometry), the tolerance applied, and a link to the full spectral report. For review-band submissions, most operations retain a human review step before customer communication, since the commercial and relationship implications of a borderline approval require judgment the automated system is not configured to apply. For first-time standards from a new customer, a period of parallel assessment — automated system running alongside human review — is advisable to validate that the configured tolerance matches the customer's actual approval behaviour before switching to fully automated release. Book a demonstration of iFactory's customer portal integration to see the full automated approval and notification workflow in action.
How should we configure different tolerance bands for the same shade when the end use varies — apparel vs. home textile vs. industrial?
The tolerance configuration is attached to the customer-shade record rather than to the shade standard alone. A single shade standard — say, a navy at L*=18, a*=−2, b*=−14 — may appear in three customer records with three different tolerance profiles: ΔE00 ≤ 0.8 for a fashion customer, ΔE00 ≤ 1.2 for a home textile customer, and ΔE ≤ 2.0 (CIE94) for an industrial customer. When the laboratory selects the shade standard for measurement, they select it from the customer's record, not from a generic shade library — so the correct tolerance is automatically applied without any manual lookup or configuration change. This structure also means the same measurement data can be simultaneously evaluated against multiple customer tolerances if a production lot is intended for multiple customers, with separate pass/fail records generated for each. iFactory's shade evaluation module supports this multi-customer tolerance architecture as a standard feature. Reach out to our support team to discuss how the tolerance library would be structured for your specific customer portfolio.
Every Shade Decision. Documented. Defensible. Routed in Under 10 Seconds.
Connect Your Spectrophotometer to Your Workflow and Eliminate the Judgment Variable from Shade Approval
iFactory's spectrophotometer integration layer connects Datacolor, X-Rite, and HunterLab instruments to a centralised shade evaluation engine — customer-specific tolerance libraries, multi-illuminant ΔE and metamerism calculation, automated pass/fail routing, and full audit trail. The first deployment typically improves first-submission pass rate by 12 to 18 percentage points within the first production month.