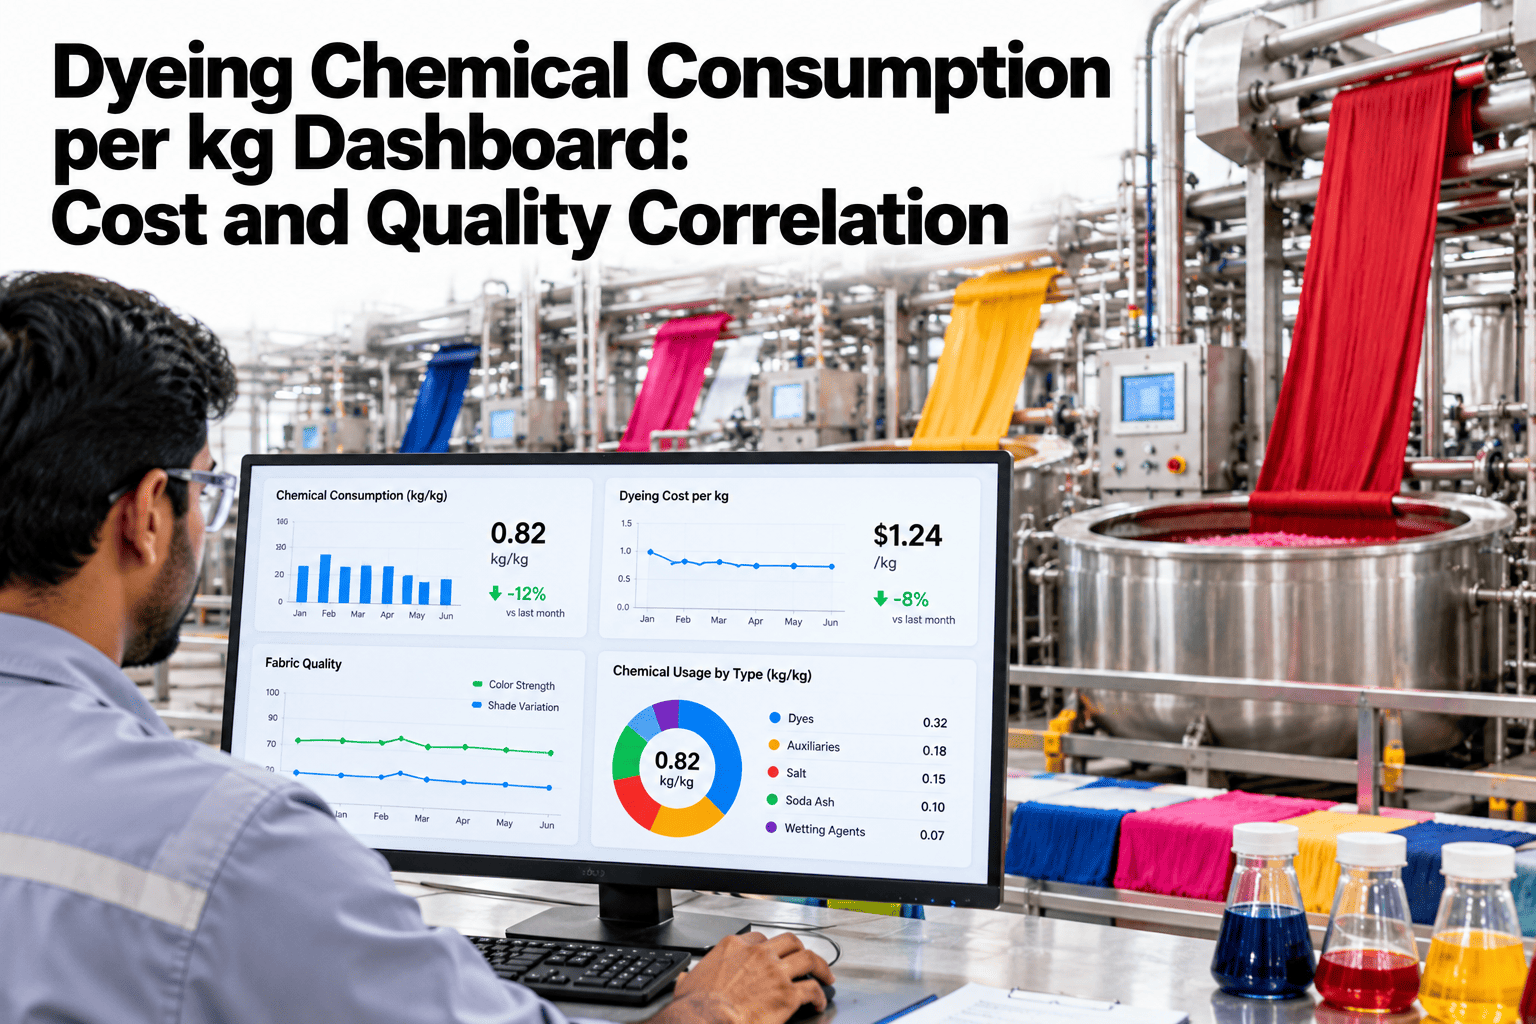
Chemical cost in a dye house rarely gets the same scrutiny energy does, even though dye, salt, auxiliary chemicals and fixing agents often add up to a bigger line item than steam and electricity combined. Dosing is usually set once per recipe and left alone, so nobody notices when a batch runs heavier on salt than it needs to, or when overdosing becomes the quiet fix for a machine that struggles with shade consistency. This guide covers how to track chemical consumption per kilogram of fabric and correlate it with quality, rework and cost, so dosing decisions stop being guesswork. Dye houses ready to see their own chemical usage tracked can book a demo with the iFactory AI team.
Dyeing Chemical Consumption per kg Dashboard: Cost and Quality Correlation
Track chemical consumption per kilogram of fabric and correlate usage with shade quality, rework and production cost.
Why Dosing Drifts Unnoticed
A recipe's chemical dosing is set once at development and rarely revisited, even as machines age, water chemistry shifts, or operators quietly adjust a dose to compensate for a problem nobody formally reported.
Without per-kilogram tracking, a slow upward drift in salt or fixing agent usage looks like normal variation rather than the cost creep it actually is.
What Gets Tracked Per Batch
Four chemical categories account for most of a dye house's variable chemical spend, and each has its own relationship to quality.
| Chemical Category | Role in the Process | Quality Link |
|---|---|---|
| Dye | Primary color agent | Overdosing can mask uneven exhaustion |
| Salt | Promotes dye exhaustion onto fiber | Under or over-dosing affects shade depth |
| Fixing agent | Locks color onto the fiber | Drives wash and rub fastness |
| Auxiliary chemicals | Levelling, pH control, wetting | Affects evenness and reproducibility |
From Dosing Record to Correlation
The analysis runs through a short sequence that joins chemical dosing with the batch's eventual quality outcome.
See If Overdosing Is Actually Helping
Book a 30-minute walkthrough and see your own chemical dosing correlated against shade quality and rework.
A Sample Correlation Finding, Illustrative
The figures below are invented to show the shape of a finding, not to benchmark your dye house.
Common Chemical Tracking Mistakes
The same gaps repeat across dye houses building their first per-kilogram chemical view.
Where the Dashboard Gets Used
Once chemical consumption is tracked and correlated, the view feeds decisions beyond the quality team's own reporting.
Procurement uses the per-kilogram baseline to forecast chemical demand more accurately. Recipe development uses the correlation data to refine dosing for problem fabrics without relying on trial and error alone.
Frequently Asked Questions
How is chemical dosing captured per batch?
Most dye houses already log chemical additions in their dosing or recipe management system, and the main work is normalising those figures to grams per kilogram of fabric rather than capturing entirely new data. Ask support how your dosing system connects.
Can this identify which operators tend to overdose?
Where dosing is logged by operator or shift, the data can surface a pattern, though the goal is usually to standardise the recipe guidance rather than single out individuals.
Does reducing dosing risk quality problems?
Any dosing change should be trialled and validated against quality outcomes before becoming the new standard, which is exactly what the correlation view is built to support. Book a demo to see how a dosing trial is validated.
Does this connect to our existing recipe management system?
In most cases, yes. iFactory AI reads dosing and recipe data from existing systems and joins it with quality and batch records automatically.
Make Every Gram of Chemical Earn Its Place
iFactory AI tracks chemical consumption per kilogram and correlates it with quality, rework and cost. Book a walkthrough built around your dye house.