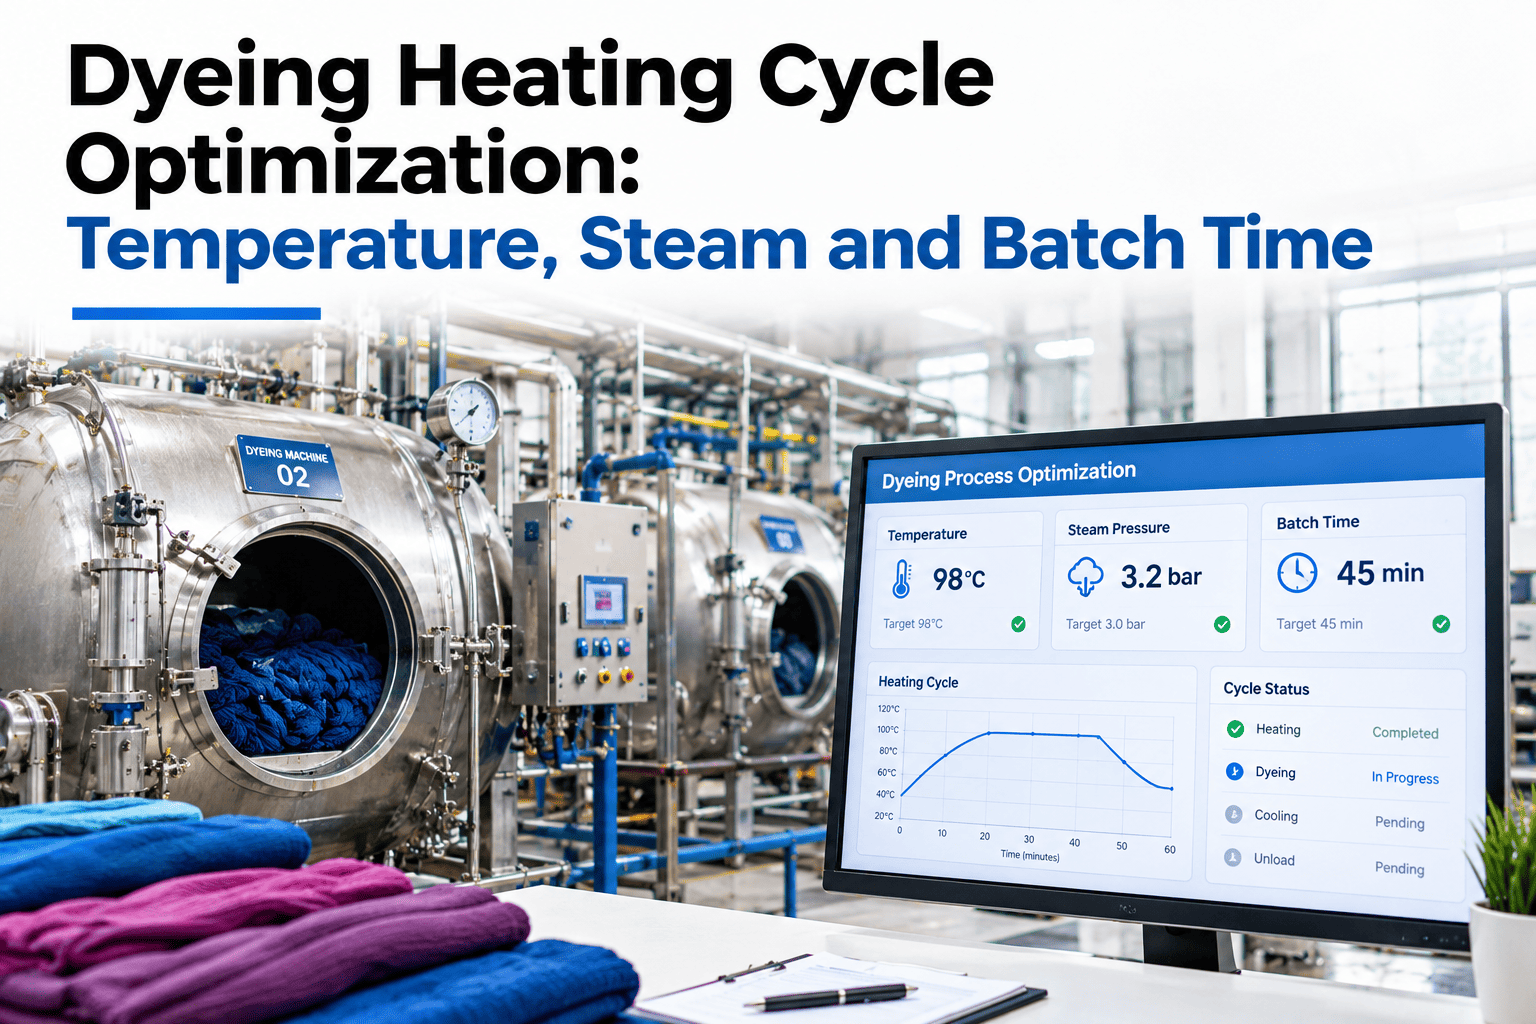
Every dyeing batch follows a heating curve, and that curve decides how much steam you burn, how long the batch runs, and whether the shade lands right the first time. Most dye houses track the final result — shade pass or fail — but very few monitor the temperature ramp, holding time, and steam draw at each stage of the cycle to know whether the process itself ran efficiently. When a batch consumes 15% more steam than the baseline with no quality benefit, the loss is real but invisible unless you are measuring it. iFactory AI brings live sensor data from steam meters, temperature probes, and batch controllers together so engineers can see every dyeing cycle's thermal fingerprint and spot the drift before it becomes a reprocessing cost.
Stop Burning Steam on Heating Curves That Were Optimized a Decade Ago
iFactory AI maps your dyeing heating curves against shade quality, batch duration, and steam draw — then shows you exactly where the cycle wastes thermal energy without improving the result.
Low steam
High steam
Peak steam
Waste zone
Minimal
What Is Dyeing Heating Cycle Optimization?
Dyeing heating cycle optimization is the process of analyzing and adjusting the temperature ramp rate, holding time, and cooling profile of each dye bath to minimize steam and energy consumption while maintaining shade quality and reproducibility. It is distinct from dye recipe management — the cycle shape, not the chemistry, is what drives thermal energy waste in most dye houses.
How Much Steam Does Dyeing Actually Consume?
Process heating accounts for 50–70% of a textile mill's total energy demand, and dyeing is consistently the most energy-intensive step within wet processing, according to a 2026 preprint study on textile steam generation published at Preprints.org. Within the dyeing department, the heating cycle — ramp and hold phases combined — typically represents 55–65% of the per-batch energy bill.
Most of that saving sits in the cycle shape, not the boiler itself. A systematic energy audit of a Turkish textile dyeing facility in 2026 (Dicle University Journal of Engineering) confirmed that optimization of cycle parameters and boiler scheduling were among the highest-return measures available — without any capital outlay on new equipment.
Where Does a Dyeing Batch Lose Thermal Energy?
Not all heat losses look the same. Understanding which stage is responsible helps engineers target the right intervention instead of blanket insulation upgrades.
The hold and over-hold zone dominates because dye fixation is typically complete 10–20 minutes before the programmed end of the hold stage. Without instrumented monitoring, operators have no way to know when fixation is done, so conservative timers run unchallenged. Engineers who want to quantify their own over-hold period can run a cycle analysis on their machine data with iFactory AI's dye house team.
Find Your Hidden Steam Waste in 30 Minutes
Share your batch controller logs and steam meter data. iFactory AI maps the heating curves, identifies over-hold periods, and shows the steam cost of each waste zone — before you change a single process parameter.
How Does Ramp Rate Affect Shade Quality?
The relationship between ramp rate and shade quality is not linear — it is dye-class specific. Reactive dyes on cotton require slow controlled ramps (1–2°C/min) to avoid unlevel fixation, while disperse dyes on polyester tolerate faster ramps (2–3°C/min) up to 130°C. Running a reactive programme's ramp rate on a polyester machine — or vice versa — burns time and energy unnecessarily. iFactory AI, an on-premise AI platform for textile quality and energy analytics, links shade assessment records to the corresponding cycle data so the correlation between ramp rate and re-dye frequency becomes visible across hundreds of batches, not just the last shift.
| Fibre / Dye class | Recommended ramp | Too fast — risk | Too slow — cost | Hold time benchmark |
|---|---|---|---|---|
| Cotton / Reactive | 1–2°C per min | Unlevel shade, rejection | +15–25% steam per batch | 45–60 min at 60°C |
| Polyester / Disperse | 2–3°C per min | Dye migration, barré | +10–20% cycle time | 30–45 min at 130°C |
| Wool / Acid | 1°C per min | Felting, fabric damage | +20–30% steam per batch | 45 min at 98°C |
| Nylon / Acid | 1.5–2°C per min | Surface unlevel | +10–15% steam per batch | 30–40 min at 95–100°C |
Benchmarks drawn from textile process engineering references. Actual values depend on machine liquor ratio, fabric weight, and dye concentration.
What Does Batch Time Optimization Look Like in Practice?
Batch time optimization is not simply running cycles faster. It is identifying which elements of the programmed cycle are adding quality value and which are simply adding cost. iFactory AI uses data from your batch management system alongside steam flow meters and temperature probes to build a statistical model of cycle performance across substrates, machines, and shifts.
Dyeing Heating Cycle Optimization vs General Energy Monitoring — What Is the Difference?
General energy monitoring tells you how many kWh or kg of steam the dye house consumed in a shift. Heating cycle optimization tells you which specific stage of which specific batch programme caused the excess, and whether that excess had any benefit for quality. The distinction matters because fixing the wrong problem wastes engineering time without reducing the energy bill.
Where iFactory AI Fits in a Dye House
iFactory AI is an on-premise industrial AI platform that runs on NVIDIA GPU servers inside your plant — your batch data, shade records, and steam meter readings never leave the facility. The dye house energy module connects to existing batch management systems via OPC-UA, Modbus, or direct sensor integration, so there is no rip-and-replace of existing equipment. Within six to twelve weeks of deployment, the cycle analytics layer is live, monitoring every heating curve across every machine on every shift.
Frequently Asked Questions
How do we know if our holding time is longer than it needs to be?
The clearest indicator is a consistent shade pass rate even when hold time varies by 15–20% — if quality does not change when the hold shortens, the extra time is pure steam cost. Connecting your batch controller timestamps to your quality lab shade assessment records reveals this correlation across hundreds of batches. iFactory AI automates this analysis so you do not need to build spreadsheet models by hand. Walk through a hold-time analysis on your own substrate data with our dye house team.
What data sources does the cycle optimization analysis need?
At minimum: batch controller logs with timestamps for each programme stage, a steam flow meter or boiler data feed with five-minute or better resolution, and your shade assessment outcomes by batch number. Additional inputs — fabric weight, liquor ratio, dye concentration, and machine load — improve the model's ability to identify the root cause of over-hold rather than just the symptom. iFactory AI integrates with Datacolor, Thies, Fong's, Brazzoli, and other major batch control systems. Ask our integration team which connectors apply to your machines.
Will reducing hold time increase re-dye frequency?
Not if the reduction is data-driven. The correct approach is to identify the statistical minimum hold time needed to achieve your shade pass threshold for each substrate and dye class, then test the reduced programme on a pilot set of batches before any broad rollout. iFactory AI's scenario tool models the quality risk on historical data before any live trial. Plants that have done this correctly report no increase in repeat-dye rate while recovering 10–20% of batch steam cost. See how the scenario model works on your specific substrate mix.
Is heating cycle optimization different from dye recipe management?
Yes — they address different variables. Recipe management optimizes dye concentration, auxiliaries, pH, and liquor ratio to achieve the target shade with minimum chemical cost. Cycle optimization adjusts the temperature programme — ramp rate, hold duration, cool-down — to achieve fixation with minimum thermal energy. Both matter, and they interact: a better recipe may allow a shorter hold, but the hold itself is a process engineering decision separate from the chemistry. iFactory AI handles both layers and links them through shared batch identifiers. Ask how the quality and energy modules connect in one platform.
What is a realistic steam saving from heating cycle optimization?
Industry experience suggests 10–20% reduction in per-batch steam consumption is achievable through hold-time trimming and ramp-rate calibration alone, before any equipment upgrade. Forbes Marshall's steam system optimization data indicates 20–24% boiler fuel cost reduction is reachable when cycle optimization is combined with condensate recovery and distribution loss work. The cycle optimization piece typically delivers the fastest payback because it requires no capital — only programme changes validated by data. Get a steam saving estimate for your dye house capacity and batch mix.
Every Heating Cycle Is Either Optimized or Wasting Steam — Find Out Which
iFactory AI maps your dyeing curves batch by batch, finds over-hold waste, and links every steam kilogram to a quality outcome. Book a 30-minute session and see your own heating curve data analyzed live.