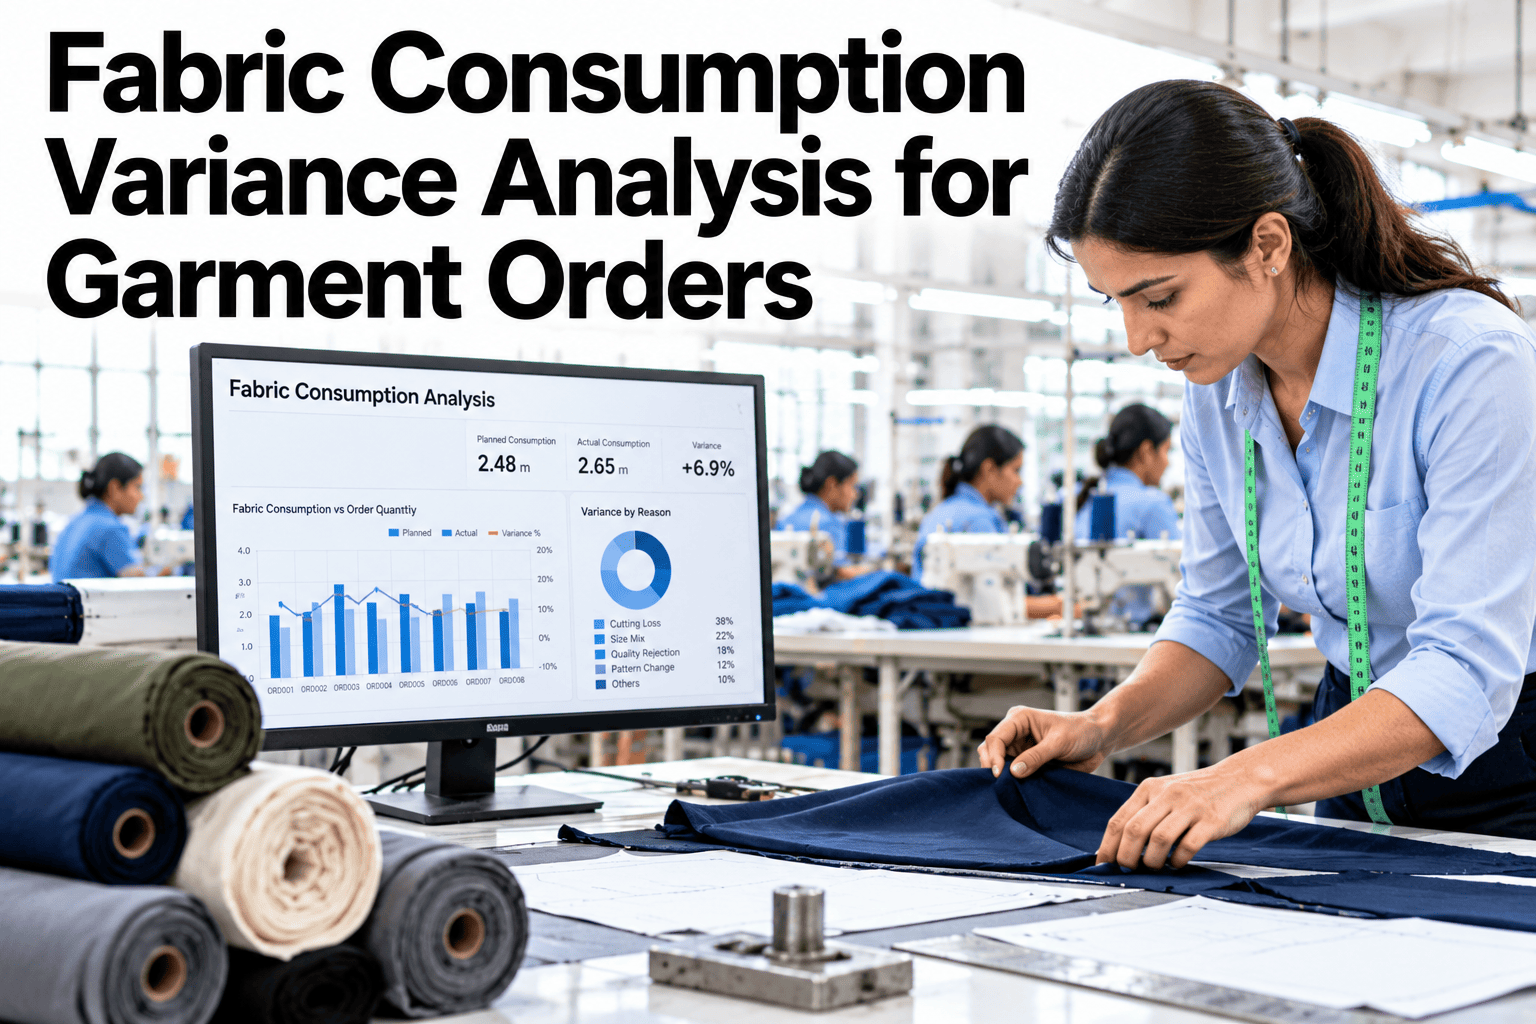
Every garment order starts with a planned fabric consumption figure, calculated from the marker and order quantity before a single roll is cut. What actually gets consumed almost never matches that figure exactly, and the gap between planned and actual consumption is where margin quietly disappears order after order. A small variance on one order looks like rounding error, but the same pattern repeating across a season adds up to a real cost nobody budgeted for. Comparing planned against actual consumption at the order level, not just the plant average, is what actually surfaces where that gap is coming from, and if you want to see the method applied to a recent order of your own, our team can walk through it.
Find Out Where Planned Fabric Consumption Quietly Drifts From Actual
Order-level variance analysis that compares planned consumption against what was actually cut, so every gap points to a specific marker, fabric lot, or process instead of a vague average.
Why Consumption Variance Hides Behind a Plant Average
Plant-wide fabric utilization numbers tend to look stable even when individual orders swing significantly, because strong and weak orders simply cancel each other out in the average.
Planned vs Actual, the Comparison That Reveals the Gap
Variance analysis starts with a simple comparison, but the value comes from doing it consistently across every order instead of spot-checking occasionally.
The gap between these two numbers, tracked order by order, is the single clearest signal of whether a plan assumption or a floor process is driving the variance.
The Most Common Sources of Consumption Variance
Once variance is tracked at the order level, a small set of recurring sources usually explains most of the gap.
| Variance source | Direction | How it usually shows up |
|---|---|---|
| Fabric width narrower than spec | Over consumption | Consistent overage tied to a specific supplier or fabric lot |
| Marker not rebuilt for size ratio changes | Over consumption | Overage appears only on orders with an unusual size breakdown |
| Remnants not logged accurately | Under or over consumption | Inconsistent variance direction across similar orders |
| Spreading length overrun | Over consumption | Overage correlates with specific spreader or shift |
Narrower fabric width is worth checking first on any recurring overage, since it is both common and easy to confirm against the original fabric specification sheet.
Run This Breakdown on Your Last Five Orders
Share planned and actual figures for a handful of recent orders and we will show where your own variance is concentrated.
From Flagged Variance to a Fixed Process
Spotting variance is only useful if it leads somewhere. Here is the short path from a flagged order to an actual process change.
What iFactory Textile Specialists See Across Order Reviews
iFactory textile specialists who review fabric consumption data across multiple plants consistently find that orders with an unusual size ratio or a fabric substitution carry the widest variance, since the original marker was rarely rebuilt to match the change.
Their general guidance is to treat any order running more than a few percent over plan as worth a quick check immediately, rather than waiting for a quarterly review, since the fix is usually a small planning correction rather than a floor problem.
What Planners Ask About Consumption Variance Tracking
Get Order-Level Fabric Variance Analysis for Your Team
Book a session with iFactory AI to see planned-versus-actual consumption broken down by style, fabric lot, and shift for your own orders.