Fabric is usually the single largest cost line in garment manufacturing, which means the cutting room is where a fraction of a percent of wasted utilization turns into a real, recurring number on the profit and loss statement every single week. A marker plan that wastes even three or four extra percent of fabric across a large order isn't a rounding error — it's often the difference between a profitable style and a break-even one. iFactory gives cutting room managers the visibility to catch utilization drift before it repeats across an entire production run.
Garment Cutting Room Efficiency: Getting the Most Fabric Out of Every Marker
CAD marker planning, spreading accuracy, and cutting precision together determine how much of every fabric roll turns into finished garment panels versus scrap.
The Cutting Room Efficiency Loop: Where Utilization Is Won or Lost
Fabric utilization isn't determined at one single point — it's the compounded result of four stages working together. A strong marker plan can still be undermined by poor spreading tension, and precise cutting can't recover fabric that a weak marker plan already wasted.
1
Marker Planning
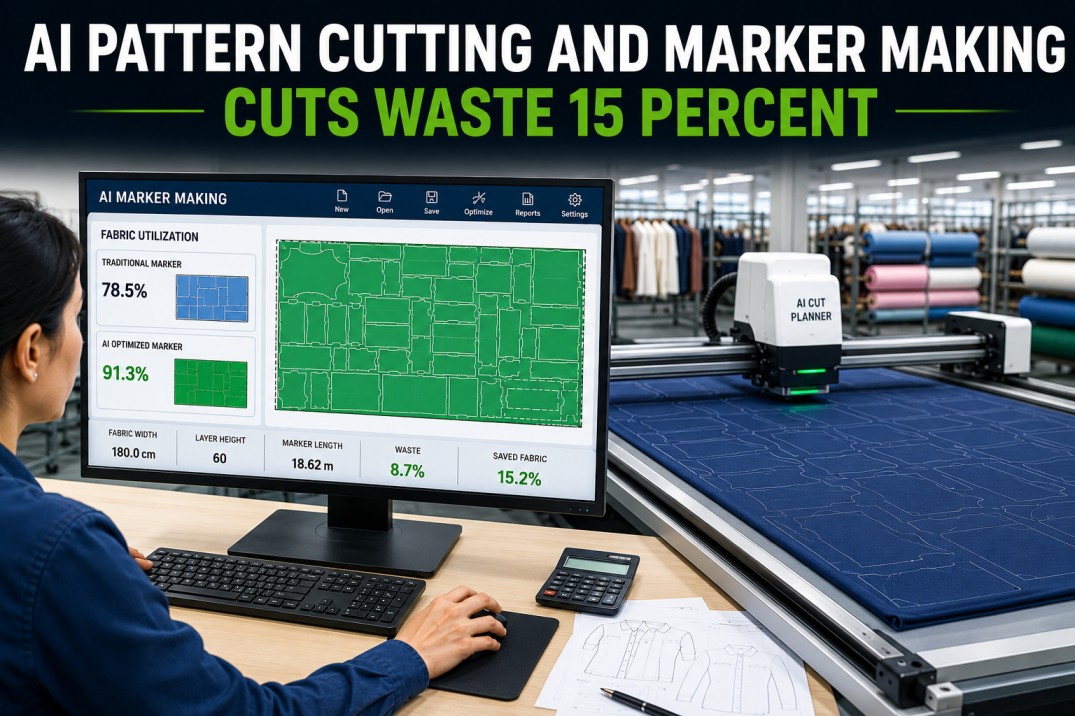
CAD software arranges pattern pieces on the fabric width to minimize gaps between panels
→
2
Fabric Spreading
Multiple fabric layers are laid flat and tension-controlled before cutting begins
→
3
Cutting Execution
Automated or manual cutting follows the marker precisely across all spread layers
→
4
Utilization Measurement
Actual fabric consumed is measured against the marker's theoretical consumption
What Drives Marker Efficiency Up or Down
Marker efficiency is the percentage of total fabric width actually covered by pattern pieces once they're arranged. Small improvements in this percentage compound significantly across thousands of garments in a single order, which is why experienced pattern engineers treat marker efficiency as a metric worth actively managing rather than a byproduct of pattern layout.
82-90%
Typical marker efficiency range for well-optimized apparel styles
1-2%
Improvement often achievable through nesting algorithm refinement alone
3-5%
Typical wastage increase from inconsistent fabric width or shrinkage variance
15-25
Layers commonly spread together per cutting cycle in bulk production
Where Fabric Waste Actually Comes From
Waste in the cutting room accumulates from several distinct sources, and reducing the largest number on a utilization report requires knowing which of these sources is actually driving the loss rather than treating all waste as the same problem.
Marker Layout Gaps
Unavoidable spaces between irregularly shaped pattern pieces that nesting software cannot fully eliminate
Fabric Width Variance
Rolls narrower than the marker was designed for force pattern pieces to shift or be re-nested mid-run
Spreading Tension Errors
Over-tensioned layers relax after cutting, causing panel dimensions to shift out of tolerance
Cutting Deviation
Blade drift or knife wear causes cut panels to stray from the marker line, requiring rework or scrap
End-of-Roll Remnants
Short fabric lengths left at the end of a roll that don't fit a full marker repeat
Fabric Defects
Flaws identified during spreading require pattern pieces to be shifted around the defect zone, adding waste
See Exactly Where Your Cutting Room Loses Fabric
iFactory tracks marker efficiency, spreading tension, and actual versus planned fabric consumption together, showing which specific stage is driving utilization loss on each style.
CAD Marker Planning Best Practices That Actually Move the Utilization Number
Marker planning software has become significantly more capable, but the improvements it delivers still depend heavily on how the pattern engineer sets constraints and reviews output. A handful of practices consistently separate high-utilization markers from average ones.
Mixing Sizes Within a Single Marker: Combining multiple garment sizes in one marker lets nesting software fit irregular shapes together more tightly than single-size markers allow.
Testing Multiple Fabric Widths: Running the same marker against several available roll widths often reveals a width that yields meaningfully better efficiency than the default assumption.
Reviewing Nesting Output Manually: Automated nesting occasionally leaves recoverable gaps that a trained eye catches and manually tightens before the marker is finalized.
Accounting for Directional Fabric: Napped, striped, or printed fabrics restrict how pattern pieces can rotate, and markers that ignore this constraint produce unusable panels on directional materials.
Frequently Asked Questions
Q: What marker efficiency should a well-run cutting room expect to achieve?
Most well-optimized apparel styles land somewhere between 82 and 90 percent marker efficiency, though the exact achievable number depends heavily on garment complexity, fabric type, and how many sizes are mixed within a single marker. Simple, boxy styles with few pattern pieces typically achieve efficiency at the higher end of that range, while garments with many curved or irregular pieces, like fitted jackets, naturally sit lower. Tracking your own historical efficiency by style category gives a more useful benchmark than comparing against a single industry-wide number.
Q: How much does mixing garment sizes in one marker actually improve utilization?
Size mixing commonly improves marker efficiency by a meaningful percentage compared to single-size markers, since nesting software has more shape variety to work with when fitting pieces together tightly. The exact improvement depends on how different the pattern shapes are across sizes, but most cutting rooms find that combining at least two or three sizes per marker delivers a noticeably better result than cutting each size separately.
Q: How does fabric width variance affect a marker that was already finalized?
A marker is designed against a specific fabric width, and rolls arriving narrower than that width force either a re-nest of the marker or manual adjustment during spreading, both of which typically reduce achieved utilization below the marker's theoretical efficiency. Consistent fabric width from the supplier, verified before spreading begins, is one of the simplest ways to protect the utilization number the marker was designed to hit.
Contact our team to discuss tracking incoming fabric width variance against your marker specifications.
Q: What role does spreading machine operation play in final utilization?
Spreading tension directly affects how accurately cut panels match the marker's intended dimensions — over-tensioned fabric relaxes after cutting and can shrink panels below spec, forcing rework or scrap, while under-tensioned fabric can wrinkle and cause cutting deviation. Consistent, monitored spreading tension is a frequently underestimated factor in overall cutting room utilization performance.
Q: How can real-time monitoring reduce fabric waste in the cutting room?
Continuous tracking of actual fabric consumption against the marker's planned consumption catches utilization drift while a batch is still cutting, rather than after a full order has already been consumed and the waste is locked in.
Book a demo to see how iFactory surfaces utilization variance by style, fabric lot, and cutting line.
Turn Fabric Utilization Into a Number You Actively Manage
iFactory gives your cutting room real-time visibility into marker efficiency, spreading accuracy, and actual fabric consumption so waste gets caught before it repeats across the full order.