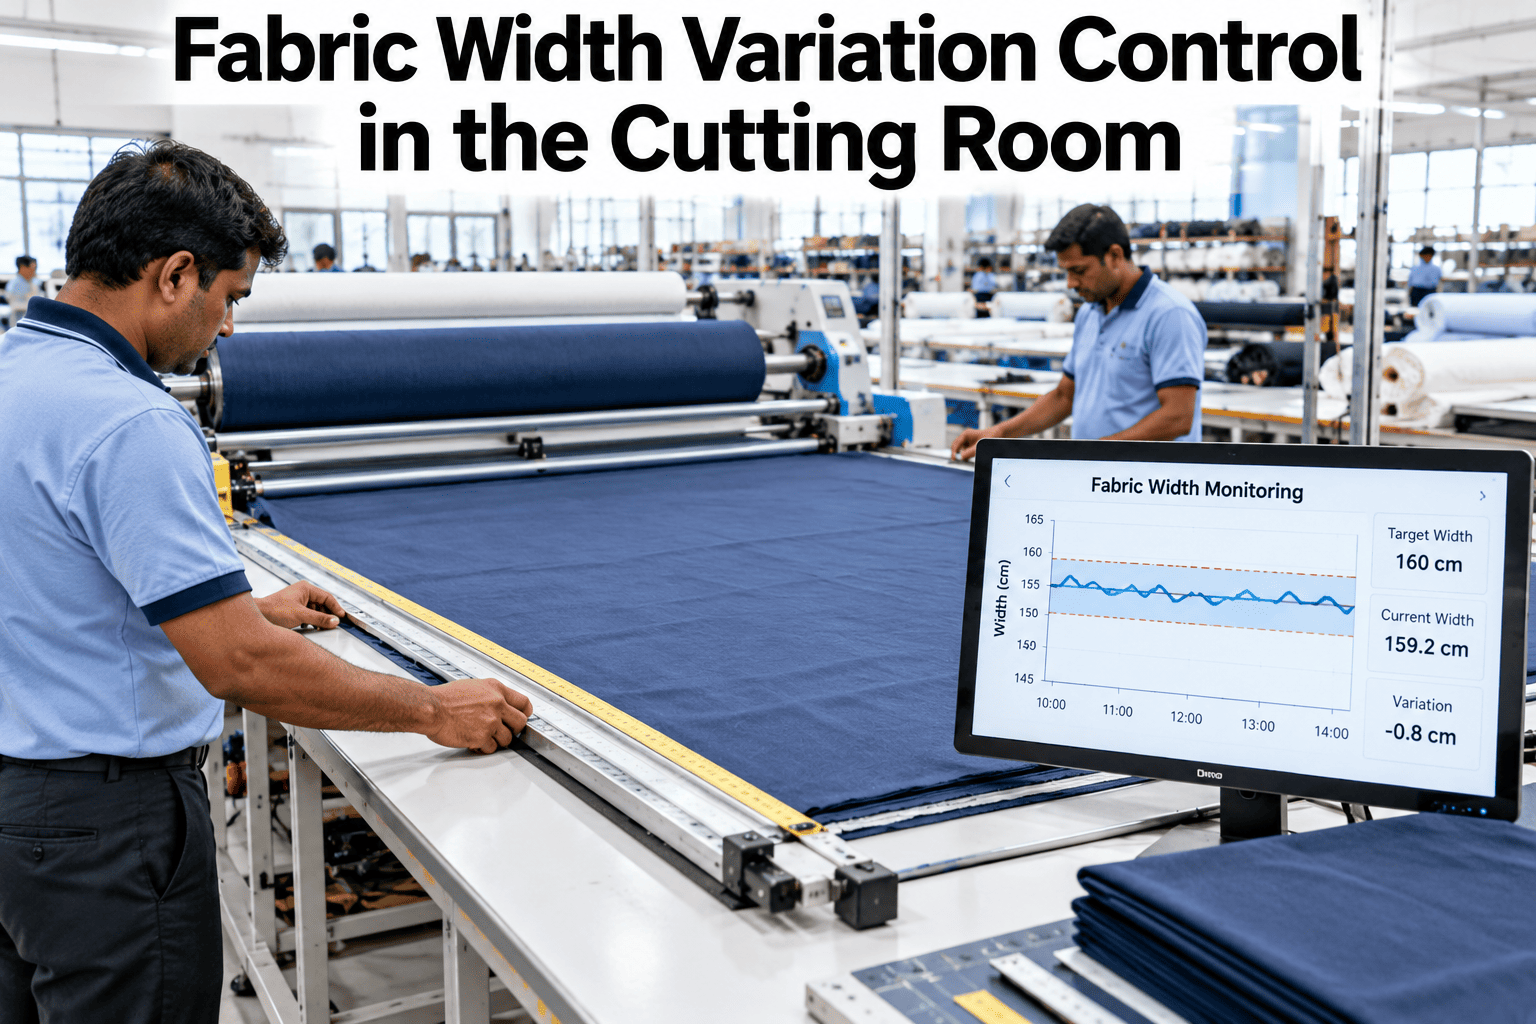
A marker is drawn for one fabric width, but the roll on the spreading bench rarely matches it exactly. A centimetre lost across the width becomes metres of extra cloth over a season, and it hides inside normal consumption figures. Cutting rooms that measure width roll by roll can see it, price it and plan for it. Teams ready to try that can book a demo to see width variation tracked from receiving to the lay.
Fabric Width Variation Control in the Cutting Room
Measure the width you can really cut, plan markers for it and trace every roll to the lay it fed. iFactory AI joins width records, marker plans and consumption so cutting waste is visible.
Three Widths, and Only One Counts
When a supplier says a fabric is 150 cm wide, that is the nominal figure. The cutting room cares about a different one: the width it can lay and cut after allowing for selvedges and defects at the edges. The gap between the two is where variation does its damage.
What the order says
The width on the purchase order and the packing list. Useful for planning, but never proof of what arrived.
What the roll measures
The edge-to-edge width on the day. It can drift along the roll and differ from roll to roll in the same lot.
What the marker can use
Actual width minus selvedges, allowances and any edge defects. This is the number that sets the marker.
Width moves for ordinary reasons: finishing tension, stenter settings, relaxation and shrinkage in storage, and differences between dye lots. None of these are scandals. They only become losses when the cutting room finds out late, at the bench, with the marker already made.
The Marker Width Rule
Marker width depends on fabric width. One online apparel guide states the rule plainly: marker width equals fabric width minus twice the sum of the selvedge width and the selvedge allowance. The marker must be narrower than the fabric, since the allowance strips on both sides cannot be used.
Now suppose the lot arrives at 148 cm. The same rule gives a marker width of 145 cm, so the 147 cm marker no longer fits. The room must re-plan at 145 cm, cut with pieces off the edge or reject the roll. Each choice has a cost, and none appears if width is not measured until the lay.
What a Lot Looks Like When You Measure It
Averages hide the problem. A lot with a nominal 150 cm can have most rolls near the figure and a tail of narrow ones. The bars show an illustrative lot of 100 rolls measured at receiving.
The average is about 150.3 cm, which looks healthy. Yet 20 rolls sit at 149 cm or below, and a marker built for 150 cm will not fit them. A planner who looks only at the average builds one marker and is surprised by a fifth of the lot.
Spread
The range, 148 to 152 cm here, is as important as the average.
Tail
The narrow rolls set the risk. Count how many fall below the marker's minimum.
Clusters
Rolls often group by dye lot or finishing run, which suggests where to split the plan.
Find the Width Your Markers Cannot Use
Book a 30-minute demo and iFactory AI will show roll widths, marker widths and consumption side by side for a cutting room.
What Width Variation Does to Marker Efficiency
Marker efficiency is the share of the marker area covered by pattern pieces. The guide gives it as the total area of the pieces times 100, divided by the area of the marker, which is its length times its width. Change the width and the same pieces nest differently.
| Situation | What Happens | Cost to the Cutting Room |
|---|---|---|
| Roll narrower than planned | Marker does not fit, or must be re-planned at a lower width | Lower efficiency, rework of markers, or cut-off pieces |
| Roll wider than planned | Marker fits with an unused strip at the edge | Cloth paid for and not used |
| Mixed widths in one lay | Plies do not line up at the edges | Trimming loss and uneven edges for cutting |
| Width drifting along the roll | Edges fall inside the marker part-way along the lay | Defects, short pieces and cut-offs |
| Late discovery at the bench | Marker already made and plotted | Remaking markers and delaying the lay |
A 2016 study in a Turkish textile journal prepared marker plans for six upper-body garment models with nesting software. The plans covered three fabric widths and four fabric types, and it treated width, model and shrinkage as the factors that drive marker plan efficiency. The full results sit behind the journal, but the design confirms what cutting rooms see: width is a primary driver of efficiency, not a detail.
Where to Measure Width, and How Often
Measure early enough to act and often enough to trust the numbers. Three checkpoints give a full picture without slowing the room.
| Checkpoint | What to Measure | Frequency | Used For |
|---|---|---|---|
| Receiving | Edge-to-edge width at start, middle and end of each roll | Every roll | Lot histogram, supplier record, marker planning |
| Pre-lay | Cuttable width after selvedge and edge defects | Every roll going to the lay | Matching rolls to marker width |
| At the bench | Width spot checks during spreading | Each lay, several points | Catching drift and mixed rolls |
| After cutting | Consumption against plan | Each lay | Closing the loop and finding hidden loss |
Use the same tool and the same method everywhere. A tape measure laid across a relaxed roll gives a different number from one stretched by hand, and an unfair comparison between shifts can be mistaken for a fabric problem. Write the method down and train everyone on it.
A Decision Ladder for Each Roll
Once cuttable width is known, the roll needs a quick, consistent decision. A ladder with set bands keeps the call out of personal judgement. The limits below are examples, so set your own with the marker room and the buyer.
The middle rung is where planning pays. If the marker room prepares a second marker for the narrow end of the lot before the rolls reach the bench, a 1 to 2 cm shortfall costs a small efficiency loss and no delay. Without it, the same roll stops the lay.
Pricing the Loss: A Worked Example
Suppose a style is cut at 147 cm marker width with 84.0 percent efficiency. A lot arrives 2 cm narrower, forcing a 145 cm marker with 83.1 percent efficiency. The figures are illustrative.
The loss from one style is modest, but a factory runs many styles from many lots every month, and the leak is continuous. The important point is that it can be avoided or reduced by knowing the width early, planning a backup marker and buying to the width that was ordered.
Shrinkage and Bowing: Neighbours of Width Variation
Width problems seldom travel alone. Shrinkage changes the usable width after relaxation, and bowing distorts the edges so that the cuttable width is smaller than the measured one.
Changes width after the fact
The 2016 study counted shrinkage with width and model as drivers of marker plan efficiency. Allow for shrinkage when setting the planned marker width, using test results per lot.
Skews the cuttable width
An online clothing guide gives bowing as deviation times 100 divided by twice the cuttable width, and says 3 percent is often allowed for wovens and 1.5 percent for prints.
Record shrinkage and bowing in the same roll record as width. The marker room can then see the whole picture for each roll, and the supplier claim, if needed, covers every defect at once.
Traceability From Roll to Lay to Bundle
When a width problem surfaces late, the question is always the same: which rolls, which lays, which bundles? A traceable chain answers it in minutes.
Remnant tracking matters here too. A short, narrower end that is recorded can be matched to a small order or a trim marker. One that is not recorded is simply waste, and it is counted as a loss that no one can explain.
Spreading Quality: Where Width Control Meets the Lay
Even a perfect marker fails on a poor lay. Spreading is where width variation turns into crooked edges, uneven plies and wasted end bits, so the spreader needs the roll data in hand.
Give the spreader a simple sheet or handheld view showing the roll numbers, their cuttable widths and the marker width for the lay. A mismatch should be visible before the first ply goes down, not after the fiftieth.
KPIs for Width Control
A small set of measures shows whether width control is improving. Review them weekly in the cutting room meeting.
| KPI | Definition | Good Direction | Warning Sign |
|---|---|---|---|
| Rolls measured | Rolls with a recorded width, divided by rolls received | Close to 100 percent | Gaps by shift or supplier |
| Width spread | Range or standard deviation of width by lot | Narrow | Wide spread in one supplier |
| Rolls below marker minimum | Share of rolls too narrow for the planned marker | Low | Rising by lot |
| Marker remakes | Markers re-planned after rolls arrive | Falling | Frequent late changes |
| Consumption variance | Actual cloth used against plan, by lay | Small and stable | Unexplained overruns |
| Claims raised | Width-related claims, and value recovered | Supported by evidence | Claims with no records |
Working With Suppliers on Width
Measurement gives you leverage. When the numbers show that one mill delivers a wider spread than another, the conversation changes from opinion to evidence, and both sides can agree on a realistic tolerance.
A written tolerance
State the cuttable width and the allowed variation in the purchase terms, and say how width will be measured.
Lot histograms
Send the supplier a simple chart per lot. Most mills want to know when their finishing drifts.
A running record
Keep a scorecard by supplier so repeat problems show up in sourcing decisions.
Be fair in return. If your own method of measuring is loose, a supplier will rightly question the figures. Calibrate your tape or gauge, use the same positions on every roll and keep the readings where the supplier can inspect them if a claim is disputed.
Over a season, the best outcome is fewer claims, not more. A mill that sees its own variation data tends to tighten its process, and the cutting room gets rolls that fit the marker the first time.
Common Width Control Mistakes
Most cutting rooms fall into the same few traps. Each has a plain fix.
A 90-Day Path to Width Control
iFactory AI is built as a turnkey server that racks in, plugs in and goes live in roughly 6 to 12 weeks, so a width control pilot for one cutting room fits inside a quarter.
What iFactory AI Adds
iFactory AI is smart manufacturing and industrial software. For textile and apparel cutting rooms it brings roll records, marker plans and consumption into one place.
Plain-Language Glossary
Shared words keep the fabric store, marker room and cutting floor aligned.
Frequently Asked Questions
What is fabric width variation control?
It is the practice of measuring the width of every roll, planning markers around the width that can actually be cut, and tracing rolls to lays. Book a demo to see it working on cutting room data.
How is marker width worked out from fabric width?
One guide gives marker width as fabric width less twice the sum of the selvedge width and the allowance. For 150 cm cloth with 1.5 cm taken each side, that gives 147 cm.
Why does a narrow lot cost more cloth?
A narrower marker nests pieces less efficiently, so more cloth is needed per garment. Book a demo to size the loss on your own styles and cloth prices.
How often should we measure width?
Measure every roll at receiving, at three points along its length, and spot check during spreading. Use the same method in every shift so the numbers can be compared fairly.
Can width records support supplier claims?
Yes, when each roll has a measured width, a photo and a lot reference. Book a demo to see claim evidence built from roll records in the platform.
Cut Smarter by Knowing the Width You Have
iFactory AI records roll widths, matches them to markers and tracks consumption so your cutting room wastes less cloth. Book a walkthrough on your own roll data.