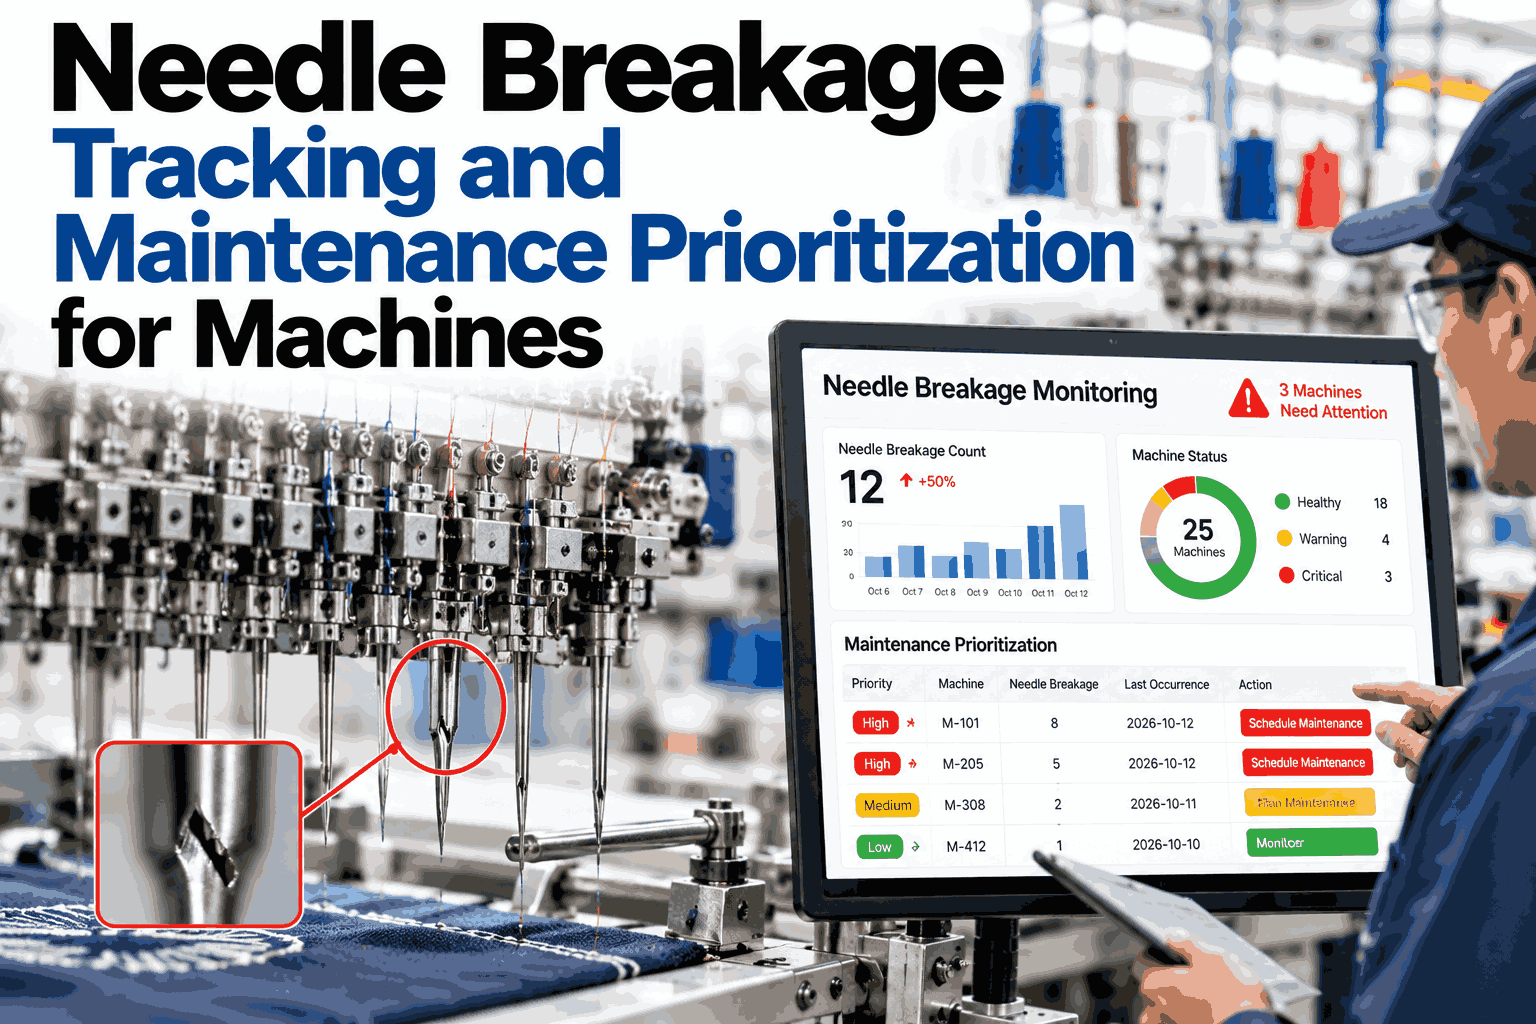
A broken needle rarely announces itself as a maintenance problem. It shows up first as a dropped stitch, a hole in the fabric, or a sudden stop that the operator logs as "machine down" with no further detail. Multiply that across a knitting floor running dozens of machines and thousands of needles, and the pattern that would point straight at a failing cam track or a worn sinker gets buried in a pile of unlinked stop records. Tracking breaks by position and machine, and prioritizing maintenance from that record, turns a reactive repair cycle into one that can be reviewed against your own breakage data in a short session.
Turn Needle Breaks Into a Maintenance Priority List, Not a Mystery
iFactory AI logs every needle break by position, machine and shift, then ranks maintenance work by what is actually costing you fabric and downtime.
Why Needle Breaks Hide Until They Are Expensive
A single needle break is a short stop and a quick fix, so it rarely gets logged beyond the shift sheet. The cost shows up later, after dozens of these small stops have quietly eaten into run time and the same needle position keeps failing.
Without a record tied to position and machine, a worn cam track or a misaligned needle bed section looks identical to ordinary wear. Nobody connects the dots until a machine's breakage rate is far out of line with the rest of the floor.
| Symptom | Likely Cause | Needle Position Pattern | First Check |
|---|---|---|---|
| Repeated breaks, same position | Cam track or sinker wear | Clustered at one point | Inspect cam track and sinker at that zone |
| Breaks spread across many positions | Tension spike or yarn defect | Scattered, no pattern | Review tensioner and yarn lot quality |
| Breaks rise after a changeover | Needle bed timing drift | New cluster appears post-changeover | Recheck timing after setup |
| Breaks climb gradually over weeks | General wear, overdue maintenance | Widening spread machine-wide | Compare against last service date |
See Your Own Breakage Pattern by Position
Book a 30-minute session and iFactory AI will map needle breaks by position and machine from your own floor data.
Where Breaks Cluster Across the Needle Bed
Plotting breaks by position across the needle bed, instead of as a single machine total, usually shows a cluster rather than an even spread. The strip below is one illustrative machine over a month.
Prioritizing Maintenance by Actual Risk
Fixed maintenance intervals treat every machine the same, regardless of how often it is actually breaking needles. A risk-based list looks different.
Breakage rate well above floor average, or a repeating cluster at the same position. Schedule inspection within days, not at the next routine interval.
Breakage rate rising but not yet severe, or a new cluster that appeared after a recent changeover. Flag for the next planned stop.
Breakage rate steady and low, consistent with normal wear. Standard preventive schedule applies, no change needed.
Twelve Weeks: Reactive Repair vs Tracked Prioritization
One floor compared needle-related downtime across twelve weeks, before and after switching from fixed-interval servicing to breakage-tracked prioritization. Each column is an illustrative weekly downtime index, tuned week as the baseline of 100.
Needle Maintenance Checklist by Frequency
A practical starting checklist, grouped by how often each check should happen once breakage is being tracked by position.
Where iFactory AI Fits
Stop logs, tension data and service records usually sit apart. iFactory AI ties them to each break by position, machine and shift.
Position-Level Logging
Every break is captured with its needle position, not just a generic machine stop code.
Risk-Ranked Priority List
Machines and positions are ranked automatically by breakage rate and trend, not by a fixed calendar.
Cause Correlation
Tension readings at the moment of each break are matched in, separating mechanical wear from tension spikes.
Downtime Impact Tracking
Each break's downtime is rolled into a cost view, so priority reflects real impact, not just a count.
Frequently Asked Questions
Do we need new sensors to track breaks by position?
Often not. Many machines already generate a stop signal at the moment of a break, and the first step is usually capturing which position triggered it alongside the existing stop log. Where position data is not available, it can be added selectively. Support can review what your machines already report before anything new is added.
How is this different from a standard maintenance schedule?
A fixed schedule services every machine at the same interval regardless of condition. Breakage-tracked prioritization moves machines up or down the list based on what they are actually doing, so a machine breaking needles weekly gets attention before a machine that has run clean for months.
Can breakage data link back to fabric defects?
Yes, and this is often where the real cost sits. A break at a specific position frequently lines up with dropped stitches or holes recorded in the same window, which turns a maintenance log into a direct link to quality cost. See this correlation walked through on your own floor.
Will this add work for operators?
No, the position and timing capture happens automatically from existing stop and tension signals. Operators keep clearing the fault and restarting as usual, while the pattern builds in the background for maintenance to review.
How often does the priority list update?
The underlying breakage data updates continuously, and the ranked priority list is designed to be reviewed daily or weekly depending on floor size. Ask support how review frequency is set up for a floor your size.
Stop Guessing Which Machine Needs Attention First
iFactory AI turns scattered needle breaks into a ranked, position-level maintenance priority list. Book a walkthrough on your own machines.