Most textile plants set defect targets the same way every year: take last year's rejection percentage, shave off a point, and call it a goal. Nobody can say why 3.5% is achievable but 2% isn't, because the number was never built from the process itself. Process capability analysis, expressed through the Cpk index, replaces that guesswork with a number derived directly from how a specific spinning frame, loom, or dye batch actually behaves against its own specification limits. Once a mill knows its real Cpk by process stage, defect targets stop being aspirational and start being mathematically defensible, which changes how quality, planning, and merchandising teams argue about what's actually possible. Teams that want a working Cpk model built around their own machine and shift data can start that conversation with iFactory's support team.
Your Defect Target Isn't a Goal. It Should Be a Calculation.
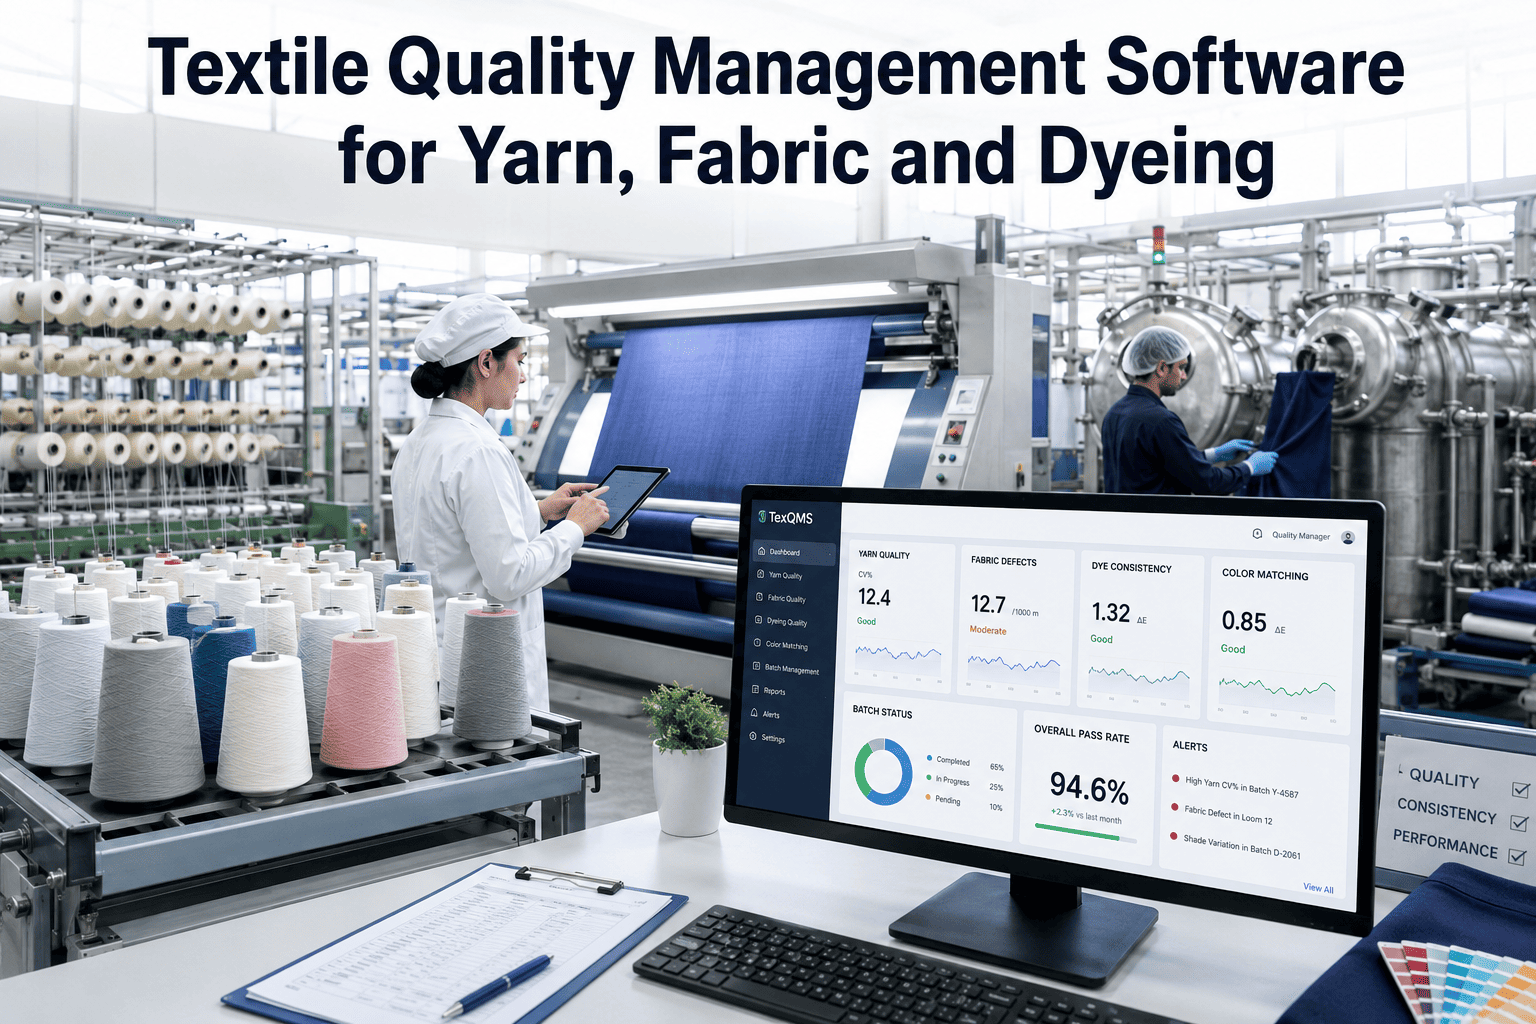
iFactory turns live spinning, weaving, and dyeing data into a continuously updated Cpk score for every critical characteristic, so defect rate targets are set from actual process capability instead of last year's number minus a hopeful percentage.
Why Flat Defect Targets Keep Failing on the Floor
A single defect rate target applied across every ring frame, loom, or dye jet ignores the reality that no two machines, operators, or raw material lots behave identically. One frame might be running well within its tolerance while a neighboring one, fed by a slightly different roving batch, is already producing count variation that will show up as a rejection two process stages later. Setting one flat number for all of them either punishes a genuinely capable machine with an unrealistic target or lets a marginal one hide behind an average that looks fine on a weekly report. Process capability analysis solves this by asking a more specific question for every machine and characteristic: given how much this exact process actually varies, what defect rate is mathematically realistic, and where does the real risk sit right now.
Averages Hide the Worst Offenders
A mill-wide average defect rate can look acceptable while two or three specific machines are quietly generating most of the rejections, unnoticed until a customer claim surfaces.
Targets Set Without Process Context
A target copied from last year's performance says nothing about whether the underlying variation actually changed, so it can be either impossible or too easy depending on drift nobody measured.
Improvement Projects Aimed at the Wrong Stage
Without a capability number per stage, improvement budget often goes to the most visible complaint rather than the process actually closest to its specification limits.
Customer Audits Ask for Numbers Mills Don't Have
Buyers increasingly request Cpk or Ppk evidence for critical characteristics during supplier audits, and a mill relying only on final inspection rejection rates has no answer ready.
Reading the Cpk Scale for Textile Processes
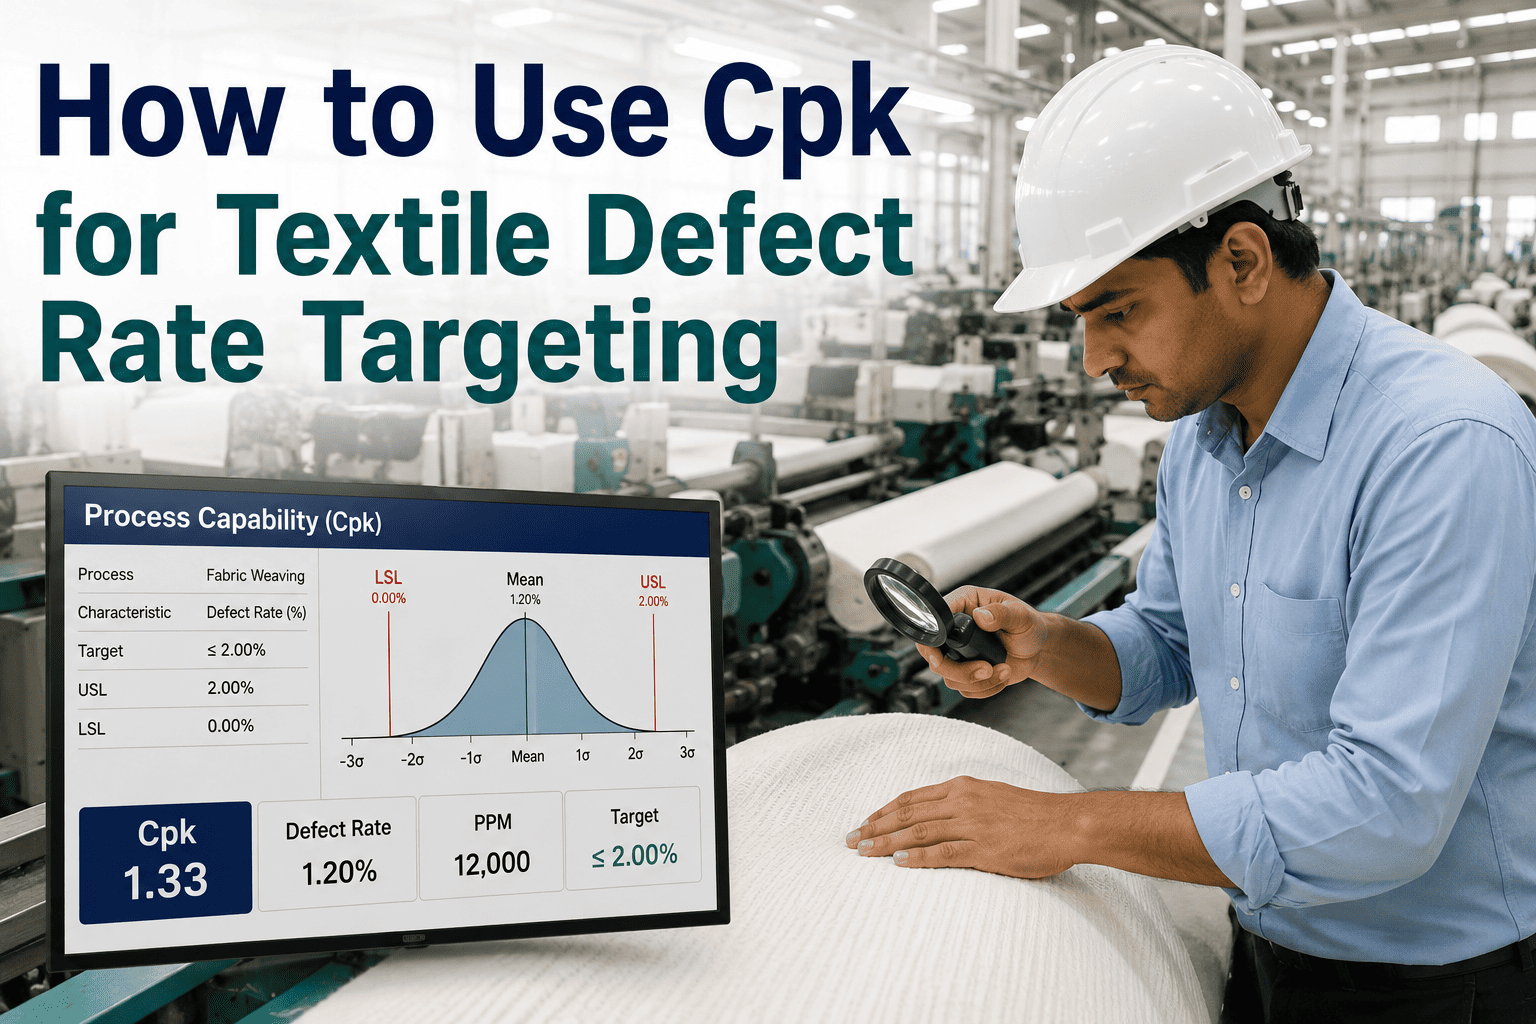
Cpk compares how much room a process has between its natural variation and its specification limits, and it does so asymmetrically, capturing a process that has drifted off-center even if its spread looks fine on paper. A Cpk of 1.00 corresponds to roughly three defective units per thousand under normal statistical assumptions, while 1.33 is the widely cited threshold for a process considered genuinely capable, and 2.00 or higher leaves enough margin that even meaningful shifts in raw material or environmental conditions rarely produce an out-of-spec unit.
| Cpk Range | What It Means | Typical Textile Interpretation | Recommended Action |
|---|---|---|---|
| Below 1.00 | Not capable, frequent out-of-spec output expected | Visible rejections, customer complaints likely | Root cause investigation before any target-setting |
| 1.00 - 1.33 | Marginally capable, tight margin for drift | Passes most days, fails during raw material shifts | Tighten control limits, monitor daily |
| 1.33 - 1.67 | Capable, standard industrial benchmark | Consistent output, occasional isolated defects | Maintain with routine SPC monitoring |
| Above 1.67 | Highly capable, wide safety margin | Rejection-driving characteristic rarely a concern | Candidate for tightened target or reduced inspection |
Setting a Defect Rate Target the Right Way
A defensible target starts with data, not intuition, and the sequence below is how a Cpk-driven target actually gets built for a specific machine and characteristic rather than for a whole mill at once.
Pick the Characteristic That Actually Drives Rejections
Yarn count, twist, pick density, GSM, or shade variation, chosen from what final inspection data already shows is causing the most rejections.
Collect a Real Sample From Stable Production
A minimum of 25-30 subgroups pulled during normal, in-control running conditions, not a rushed sample gathered right after a machine adjustment.
Confirm the Process Is Actually Stable First
Control charts have to show statistical control before a Cpk number means anything, since capability studies on an unstable process just measure the instability.
Calculate Cpk Against the Real Specification Limits
Using the buyer's or internal spec, not a rounded convenience number, since even small spec-limit rounding meaningfully shifts the resulting Cpk.
Translate the Score Into an Honest Defect Target
A Cpk of 1.05 does not support a target of near-zero rejections, and setting one anyway just guarantees the target gets missed every month.
Stop Guessing at Defect Targets and Start Calculating Them
iFactory continuously calculates Cpk for every critical characteristic across spinning, weaving, and dyeing, turning capability data into targets your floor can actually hit and buyers can actually trust.
A Composite Scenario: The Loom That Was Never the Problem
A mid-size weaving unit had spent nearly a year rotating its best technicians onto Loom 12, convinced that pick density variation on that machine was driving a persistent fabric rejection rate that would not budge below four percent. Every adjustment brought short-term improvement followed by the same drift returning within a week, and the maintenance team was increasingly confident the loom itself needed a major overhaul.
A capability study run across all twelve looms told a different story. Loom 12's Cpk for pick density sat at 1.31, solidly within the capable range, while three other looms feeding the same fabric quality showed Cpk scores between 0.71 and 0.89 for GSM consistency, a characteristic nobody had been actively monitoring because it rarely triggered an immediate visual rejection at the loom. The real driver of downstream fabric rejection was GSM drift accumulating quietly across those three machines and only becoming visible once fabric reached final inspection and customer testing.
Common Mistakes Mills Make With Capability Studies
Running Cpk on an Unstable Process
A capability number calculated before a process shows statistical control is not a measurement of capability, it's a measurement of chaos dressed up as a decimal.
Treating One Mill-Wide Cpk as Meaningful
Averaging capability across every machine of the same type erases exactly the variation between individual units that a capability study exists to reveal.
Recalculating Rarely or Never
Raw material lots, seasonal humidity, and machine wear all shift capability over time, so a Cpk calculated once during commissioning stops reflecting reality within months.
Ignoring Marginal Scores Until They Fail
A Cpk sitting between 1.00 and 1.20 is a warning, not a pass, and waiting for it to actually generate a customer claim before acting wastes the entire early-warning value of the number.
Is Your Mill Ready to Move From Rejection Rate to Capability Score
You already know which characteristics drive most rejections
A final inspection log that categorizes rejection reasons is enough of a starting point to prioritize the first capability studies without waiting for a bigger data project.
Your machines already generate some measurable data
Count, twist, tension, GSM, or shade readings taken manually or automatically both work as a starting dataset, though automated logging accelerates how quickly a reliable study can run.
Quality and production teams agree on the real spec limits
Capability studies are only as accurate as the specification limits fed into them, so this alignment step matters more than most mills initially expect.
Leadership will act on marginal scores, not just failures
The entire value of a capability program depends on treating a 1.05 Cpk as a signal to intervene, not a number to revisit only after it drops further.
Frequently Asked Questions
What's the practical difference between Cp and Cpk for textile processes?
Cp measures how wide a process's natural variation is compared to the specification width, assuming the process is perfectly centered between its limits, which is rarely true on a real production floor. Cpk accounts for that off-center reality, so a loom running consistently but drifted toward one edge of its tolerance will show a lower Cpk than Cp even though its spread hasn't changed. For most textile quality decisions, Cpk is the more honest number because it captures both variation and centering in a single score. Mills wanting help setting up both calculations correctly can reach iFactory support for a walkthrough specific to their process data.
How many samples do we actually need before a Cpk number is trustworthy?
Most standard references recommend at least 25 to 30 subgroups collected during genuinely stable, in-control production before treating a Cpk result as reliable, though the exact minimum depends on the subgroup size and how much natural variation the process shows. A study built from fewer samples, or from samples pulled right after a machine adjustment or material change, tends to produce a number that looks precise but doesn't hold up when recalculated the following week. Continuous automated data collection removes much of this sampling burden by building the study from ongoing production rather than a one-time manual exercise.
Can Cpk actually predict our real defect rate, or is it just theoretical?
Cpk provides a modeled estimate of defect probability based on the assumption that the characteristic follows a roughly normal distribution and the process remains stable, which makes it a strong planning tool but not a guaranteed count of actual rejections. Real-world defect rates can run higher than the Cpk model predicts if the underlying distribution is skewed, or if instability creeps in between studies. The most reliable approach treats Cpk as the target-setting and prioritization tool it's designed to be, while tracking actual observed rejection data alongside it to confirm the two stay reasonably aligned over time.
Do buyers and auditors actually ask mills for Cpk data during quality audits?
Increasingly, yes, particularly for technical textiles, automotive fabric, and any application where a buyer's own quality system requires statistical process control evidence from their supply chain. A mill that can produce a current Cpk trend for a critical characteristic during an audit demonstrates a materially more mature quality system than one relying only on final inspection pass rates. Book a demo to see how continuously calculated capability data gets packaged into audit-ready reporting.
How often should capability studies actually be recalculated?
A capability score calculated once during commissioning or a single audit cycle stops reflecting reality as raw material lots, seasonal humidity, and normal machine wear shift the underlying variation, which is why static, once-a-year studies routinely surprise mills when the next audit finds a different number than expected. Continuous or at minimum monthly recalculation catches that drift while there's still time to act on it, rather than discovering a capability collapse only after rejection rates have already climbed and a customer has already noticed.
Build Defect Targets Your Floor Can Actually Hit
iFactory continuously tracks Cpk across every critical textile characteristic and turns capability data into realistic, machine-specific defect rate targets your teams will actually meet.