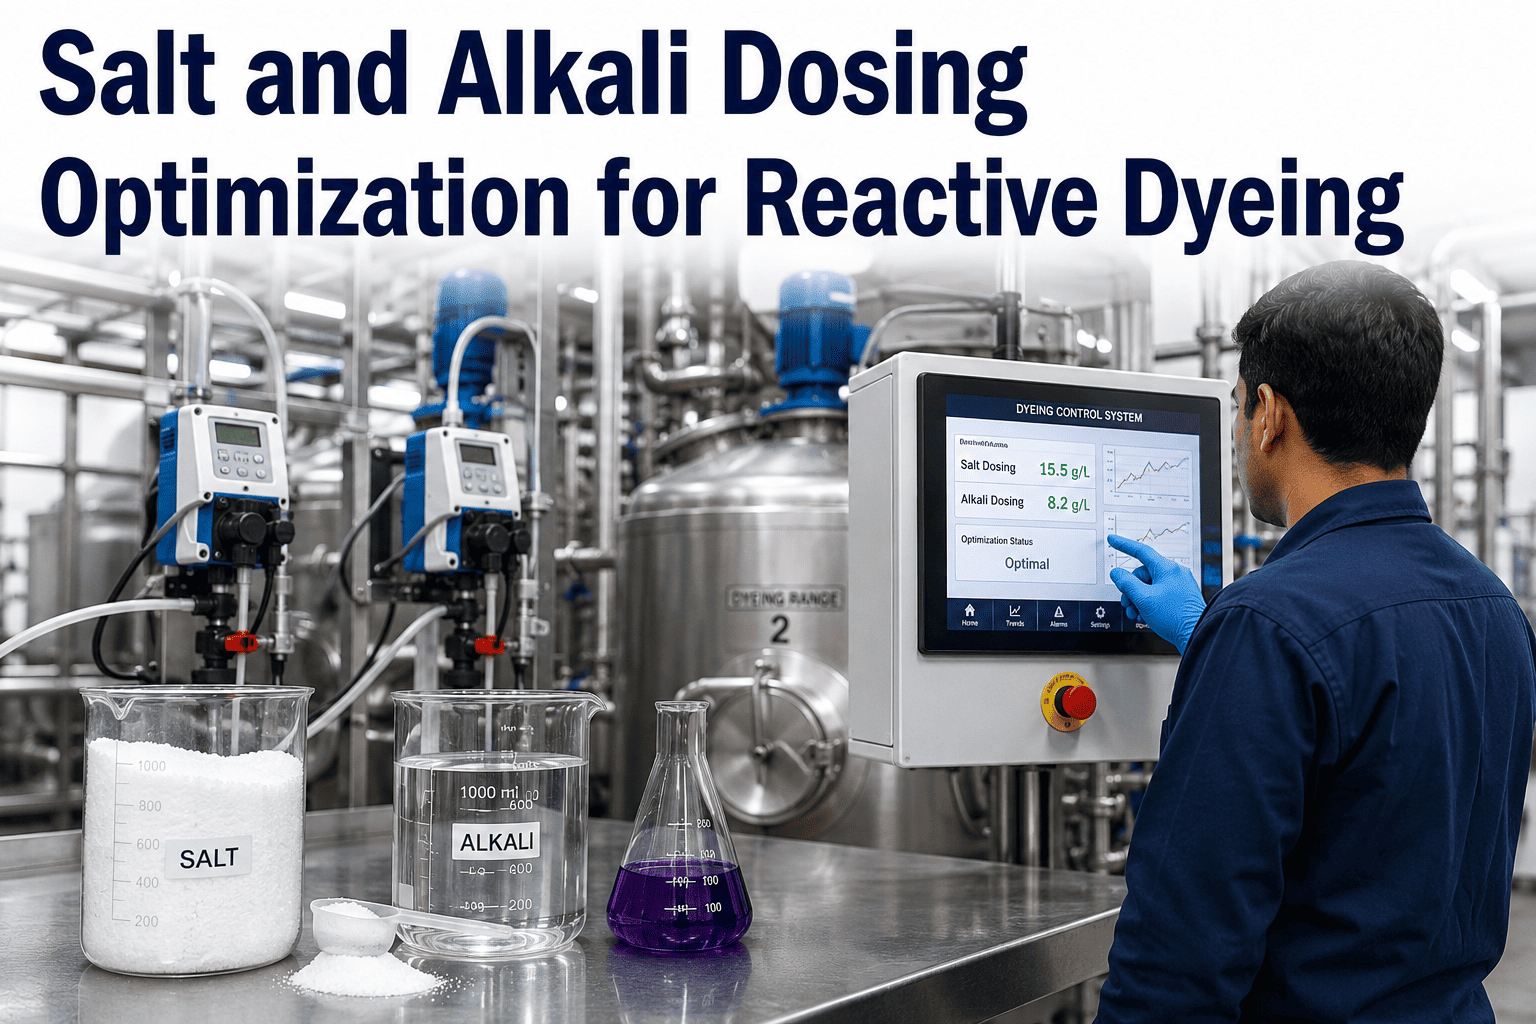
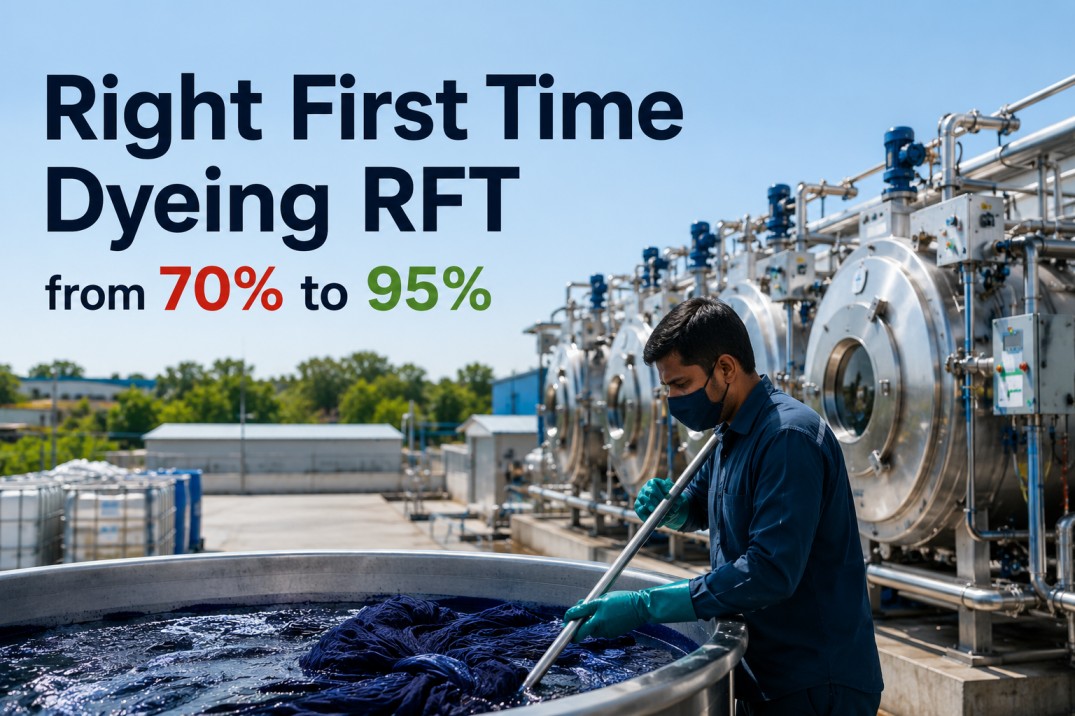
A single reactive dyeing batch that misses shade by even 2-3% on the grey scale forces a full re-dye, burning 40,000 to 80,000 liters of water, 6-10 hours of machine time, and thousands of dollars in dye and chemical cost on a single lot. Most textile mills still run right-first-time rates between 65% and 80%, meaning one in every four to five batches needs correction before it ever reaches the finishing floor. The gap almost always traces back to three variables that are rarely monitored in real time: salt dosing curves, alkali addition timing, and bath temperature drift. Book a demo to see how iFactory tracks every dyeing parameter batch by batch.
Reactive Dyeing Intelligence
Your Reactive Dyeing Recipe Is Only as Good as Its Weakest Dosing Curve
Real-time monitoring of salt addition, alkali dosing, temperature ramp, and liquor ratio - turning right-first-time dyeing from a hope into a repeatable outcome, batch after batch.
65-80%
Typical RFT rate without monitoring
40-80K L
Water lost per re-dyed batch
6-10 Hrs
Machine time consumed by rework
95%+
Achievable RFT with process control
The Five Stages Where Reactive Dyeing Recipes Break Down
Reactive dyeing on cotton follows a fixed sequence, and every stage carries its own failure risk. Skip proper monitoring at any single stage and the entire batch is compromised, because reactive dyes cannot be "fixed" retroactively once the fiber-reactive bond has formed incorrectly. Understanding where recipes actually break down is the first step toward controlling them.
1
Fiber Preparation
Scouring and bleaching consistency determines dye uptake uniformity. Residual alkalinity or uneven wetting creates patchy exhaustion before the dye even enters the bath.
2
Dye Dissolution
Incomplete dissolution or improper dye-to-water ratio leaves undissolved particles that create specks and uneven color on the finished fabric.
3
Salt Addition
Salt drives dye exhaustion onto the fiber. Adding it too fast causes uneven strike and tailing; too slow wastes cycle time and risks incomplete exhaustion.
4
Alkali Fixation
Alkali triggers the covalent bond between dye and cellulose. Dosing rate and pH stability here directly control fixation efficiency and wash fastness.
5
Rinsing and Soaping
Removing unfixed hydrolyzed dye determines final shade accuracy and crock fastness. Inadequate rinsing leaves color that bleeds in later wash cycles.
Where Right-First-Time Dyeing Actually Fails
Shade rejection is rarely caused by a single dramatic error. It is almost always the accumulation of small deviations across the dosing curve that, together, push the final shade outside acceptable delta-E tolerance. The table below breaks down the most common root causes mills report, ranked by how frequently they appear in rework investigations.
| Root Cause |
Frequency in Rejects |
Typical Shade Deviation |
Detection Method |
| Inconsistent salt dosing rate |
34% |
Delta-E 1.2-2.5 |
Flow rate sensors on dosing line |
| Temperature overshoot during ramp |
27% |
Delta-E 0.8-2.0 |
Continuous bath temperature logging |
| Alkali addition too early or fast |
19% |
Delta-E 1.5-3.0 |
pH probe with dosing interlock |
| Liquor ratio variance batch to batch |
12% |
Delta-E 0.6-1.4 |
Load cell and water meter validation |
| Incomplete dye dissolution |
8% |
Delta-E 2.0-4.0 |
Turbidity check before bath addition |
Salt and Alkali Dosing: The Curve That Decides Your Shade
Every reactive dye class has a proven salt and alkali addition curve, but curves on paper only matter if they are followed to the minute on the shop floor. Manual dosing, even by experienced operators, drifts by 3 to 8 minutes per stage over a full shift. That drift compounds across a batch and is the single largest contributor to unplanned shade variation.
0 min
Dye addition, bath at 40-60C
10-20 min
Salt added in 2-3 split doses
30-40 min
Temperature ramps to fixation point
45-55 min
Alkali dosed gradually over 20-30 min
75-90 min
Hold at fixation temperature
100+ min
Drain, rinse, and soaping cycle begins
Deviating from this window by more than 5 minutes at the salt or alkali stage is the leading cause of tailing and uneven strike reported across mill process audits.
Stop Guessing Why Yesterday's Batch Failed Shade Approval
iFactory logs every dosing event, temperature reading, and pH shift against your approved recipe, flagging deviations the moment they happen instead of after the lab report comes back.
Temperature Profile Discipline by Dye Class
Not every reactive dye behaves the same way on the temperature curve. Cold-brand dyes exhaust at 30-40C while hot-brand dyes require 60-80C for proper fixation, and mixing recipes across brands without adjusting the ramp rate is a common but avoidable mistake. Getting the ramp rate wrong by even 1-2C per minute changes exhaustion kinetics enough to shift the final shade.
Cold Brand Dyes
30-40C
Fast-reacting dichlorotriazine types requiring tight temperature control since fixation begins almost immediately after alkali contact.
Warm Brand Dyes
40-60C
Vinyl sulfone and mixed-reactive types offering a balance of reaction speed and process tolerance for most standard cotton goods.
Hot Brand Dyes
60-80C
Monochlorotriazine types needing higher fixation temperature but offering more forgiving handling during the salt addition window.
The RFT Scorecard: What Process Control Actually Delivers
Mills that move from manual recipe sheets to real-time dosing and temperature monitoring see measurable movement across every metric that matters to the dye house, not just shade acceptance. The comparison below reflects typical before-and-after results reported after implementing continuous process monitoring on reactive dyeing lines.
Right-First-Time Rate
Before: 68%
After: 95%
Water Used per Rejected Batch
Before: 60,000 L
After: 12,000 L
Average Rework Cycles per Month
Before: 22
After: 4
Dye and Chemical Cost Recovery
Before: Baseline
After: 18-22% Savings
Building an RFT Program: The Four-Phase Path
Mills rarely need to replace their dyeing machinery to fix an RFT problem. The recipe is usually correct on paper; the gap is execution consistency. Here is the phased path that dye houses follow to move from paper recipe sheets to a monitored, repeatable process.
Phase 1
Baseline the Current Process
Audit dosing timing, temperature logs, and shade rejection data across your last 90 days of production to identify which recipes and which machines carry the highest rework rate.
Phase 2
Instrument the Dosing Line
Install flow sensors on salt and alkali dosing systems along with continuous bath temperature probes, connected to a platform that compares live readings against the approved recipe curve.
Phase 3
Set Deviation Alerts
Configure real-time alerts when dosing rate, temperature, or pH drifts outside recipe tolerance, giving operators the chance to correct mid-batch rather than discover the deviation at lab check.
Phase 4
Standardize Across Machines
Roll out the validated recipe and monitoring profile across every dyeing machine running that dye class, closing the machine-to-machine variance that causes shade mismatch between lots.
Frequently Asked Questions
What causes shade variation between batches using the same reactive dye recipe?
The most common cause is timing drift in salt and alkali addition rather than the recipe itself being wrong. Manual dosing by different operators or across different shifts introduces variance in exactly when and how fast salt and alkali are added, which changes dye exhaustion and fixation kinetics even though the total quantities match the recipe sheet. Liquor ratio inconsistency and temperature ramp rate differences between machines add further variance.
Book a demo to see how real-time dosing tracking closes this gap.
How much water and cost does a single re-dyed reactive batch typically waste?
A standard batch on a jet or winch dyeing machine consumes 40,000 to 80,000 liters of water depending on liquor ratio and machine size, and re-dyeing means running that full volume again along with fresh dye, salt, and alkali. Combined with 6 to 10 hours of lost machine time and the labor involved in stripping and re-dyeing, a single reject typically costs between $800 and $2,500 depending on fabric type and dye class, not counting the delivery delay to the customer.
What is the difference between cold, warm, and hot brand reactive dyes in terms of process control?
Cold brand dyes such as dichlorotriazine types react almost immediately once alkali is added, so temperature and dosing timing must be tightly controlled from the start of the alkali stage. Hot brand dyes such as monochlorotriazine types need sustained higher temperature for fixation but are more forgiving during the salt addition window. Mixing recipes or running a hot brand dye at a cold brand's temperature profile is one of the most frequent causes of incomplete fixation and poor wash fastness.
Can process monitoring actually improve right-first-time rate without changing the dye recipe?
Yes, in most cases the recipe formulation is already correct and the gap is execution consistency on the shop floor. Continuous monitoring of salt and alkali dosing rate, bath temperature, and pH against the approved recipe curve catches deviations while the batch is still running, giving operators a chance to correct course before the dye has fully exhausted or fixed incorrectly. Mills typically see right-first-time rates move from the 65-80% range to above 90% within a few months of implementing this kind of monitoring, without reformulating a single recipe.
Contact our support team to discuss your current RFT baseline.
How long does it take to see measurable RFT improvement after installing dosing monitors?
Most dye houses see their first flagged deviation and correction within the first week of monitoring being active, since dosing timing drift is common and immediately visible once tracked. Meaningful improvement in right-first-time rate, typically a 10 to 15 percentage point gain, is usually visible within 30 to 60 days as operators adjust to real-time feedback and recipes are standardized across machines. Full stabilization near the 90-95% RFT range generally takes 3 to 4 months as the monitoring data is used to fine-tune recipe tolerances for each dye class and fabric construction running through the mill.
Every Batch Should Match the Recipe You Approved
iFactory connects your dosing systems, temperature probes, and pH sensors into one live view of every reactive dyeing batch, flagging drift before it becomes a rejected lot.