A cutting room can run a flawless marker plan, a perfectly calibrated spreading machine, and still lose eight to twelve percent of every roll to two problems that have nothing to do with the marker itself — a defect sitting inside the spread that nobody saw until the cutter's blade went through it, and a shade shift between rolls that only becomes visible once the finished garment panels are stitched together. Both losses are preventable the same way: by knowing exactly where every flaw sits and exactly how every roll's shade compares before a single ply gets laid. If fabric loss in your cutting room is running anywhere near industry average, it's worth seeing how defect mapping actually changes the spreading decision — book a demo.
Stop Cutting Through Flaws You Never Knew Were There
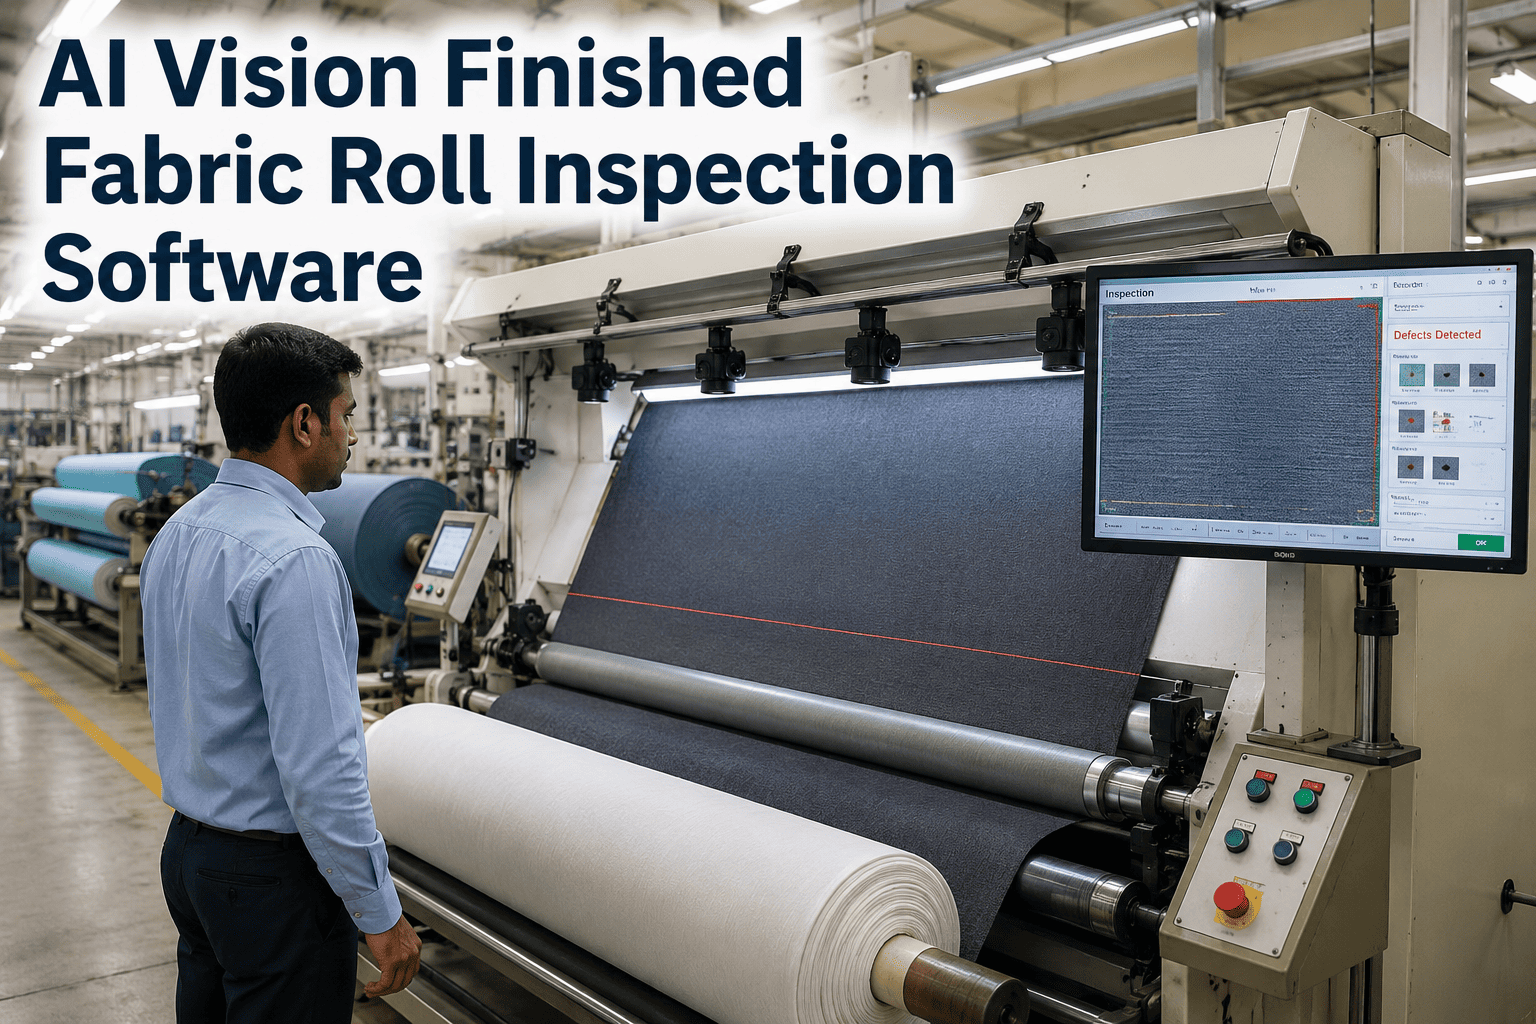
Spreading and defect mapping give the cutting room a digital record of every flaw and shade variation in a roll — before the spread goes down, not after the marker cuts through it.
Where the Waste Actually Comes From
Most cutting rooms treat fabric loss as a fixed cost of doing business — a percentage baked into every costing sheet and never really interrogated. In practice, the loss breaks down into a small number of specific, addressable causes.
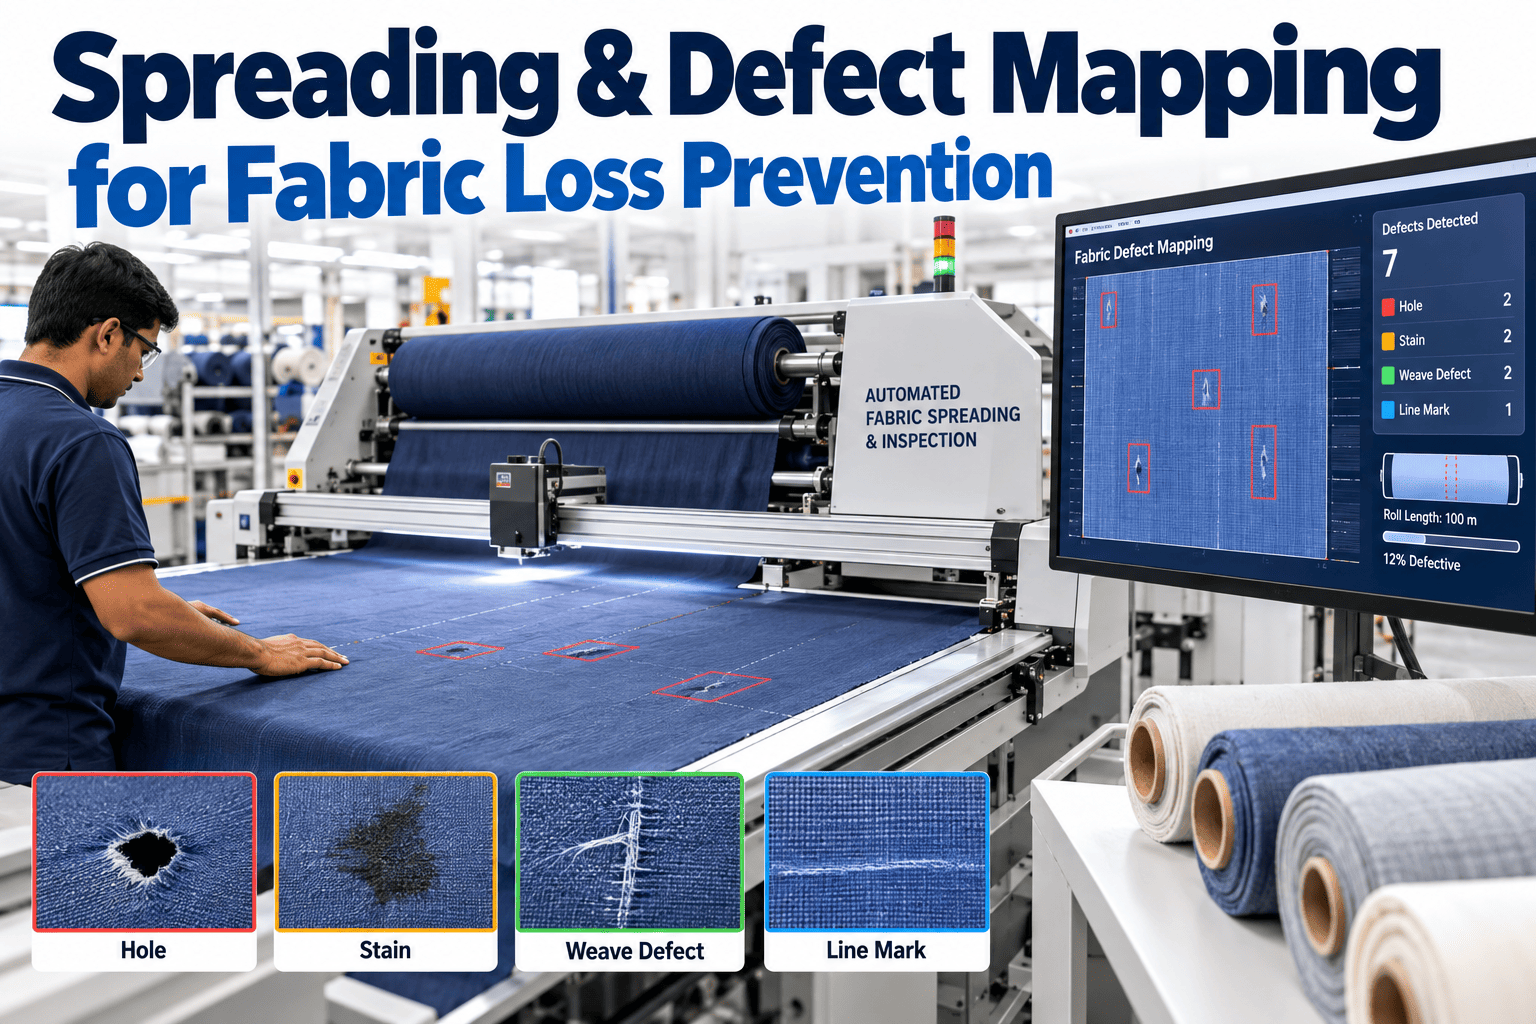
A hole, a slub, an oil stain, or a misweave sitting inside a spread does not announce itself. Spreaders working from the roll's outer wrap have no way to see three plies down, and by the time the cutter reaches that defect, it has already been layered under dozens of garment pieces that now carry the flaw straight into the sewing room.
How Defect Mapping Actually Works
The idea is simple — know where every flaw is before you cut. Getting there reliably takes a five-step pipeline that runs ahead of the spreading machine rather than reacting after the fact.
Shade Sorting Solves a Problem Defect Mapping Alone Can't
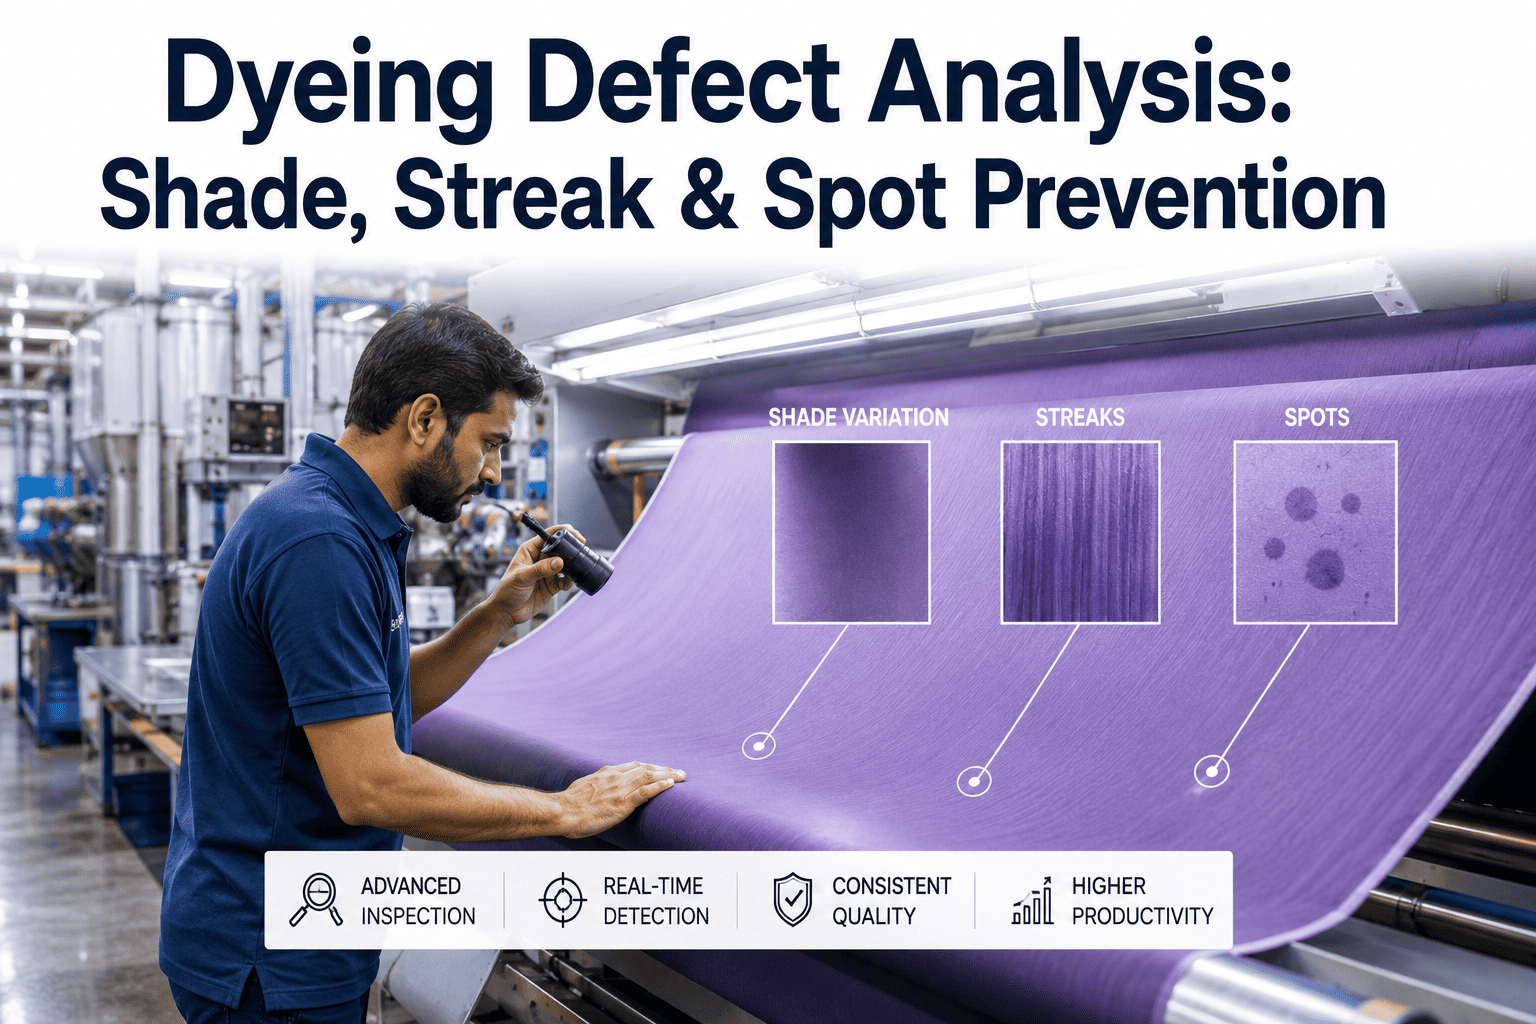
A roll with zero physical defects can still ruin a garment run if its shade drifts from the roll next to it on the rack. Dye-lot variation and even within-roll shade banding are common enough that most cutting rooms build in manual shade-checking steps — and manual shade matching under variable lighting is one of the least reliable checks in the entire process.
AI-based shade measurement scans each roll and segments it into shade groups automatically, rather than relying on an operator's eye under whatever light happens to be near the inspection table that day. Rolls in the same shade group get routed to the same cutting job, so every panel in a finished garment comes from fabric that was actually measured to match.
See Your Defect Rate Mapped, Not Estimated
Most cutting room waste estimates come from costing sheets, not measurement. A short walkthrough against a few of your own rolls shows the real number.
Automatic Roll Allocation — Matching the Right Roll to the Right Job
Once every roll has a defect map and a shade group, the allocation decision stops being a manual guess made by whoever is nearest the fabric store. The system can match rolls to orders based on usable yardage after defects, shade compatibility with the rest of the order, and how much offcut a given roll length would leave behind.
| Waste Source | Typical Loss | How Mapping Prevents It |
|---|---|---|
| Cutting through undetected defects | 3–5% of roll yardage | Marker splices around logged defect coordinates automatically |
| Shade mismatch between panels | 2–4% rework or rejection | Shade-grouped roll allocation keeps panels within tolerance |
| Poor roll-to-order matching | 2–3% excess offcut | Allocation engine matches usable length to order size directly |
| Manual splice decisions | 1–2% over-splicing | Splice points suggested only where a defect actually requires one |
None of these categories require heroics to fix — they require the information to exist in a usable form before the spreading decision gets made, rather than being discovered mid-spread when the only options left are expensive ones.
Fitting Into the Cutting Room You Already Run
Inspection and mapping do not replace the spreading machine or the marker planning software already in use — they sit ahead of both, feeding data into decisions that used to be made without it.
Roll maps export in formats that most marker planning systems already accept, so the splice suggestions show up inside the same planning screen operators already use rather than as a separate tool to learn. Shade group data ties into the fabric store's inventory system, so allocation happens at the point a job is scheduled, not after rolls have already been pulled to the floor.
For mills and garment units running mixed fabric types across multiple lines, the inspection stage typically starts at the highest-waste fabric family first — usually the one with the tightest shade tolerance or the highest defect rate — before expanding to the rest of the cutting room's fabric mix.
Spreading & Defect Mapping — Questions Cutting Room Teams Ask
Know the Roll Before It Hits the Table.
iFactory maps every defect and shade variation before spreading begins, so the marker plan works around real flaws instead of discovering them mid-cut.