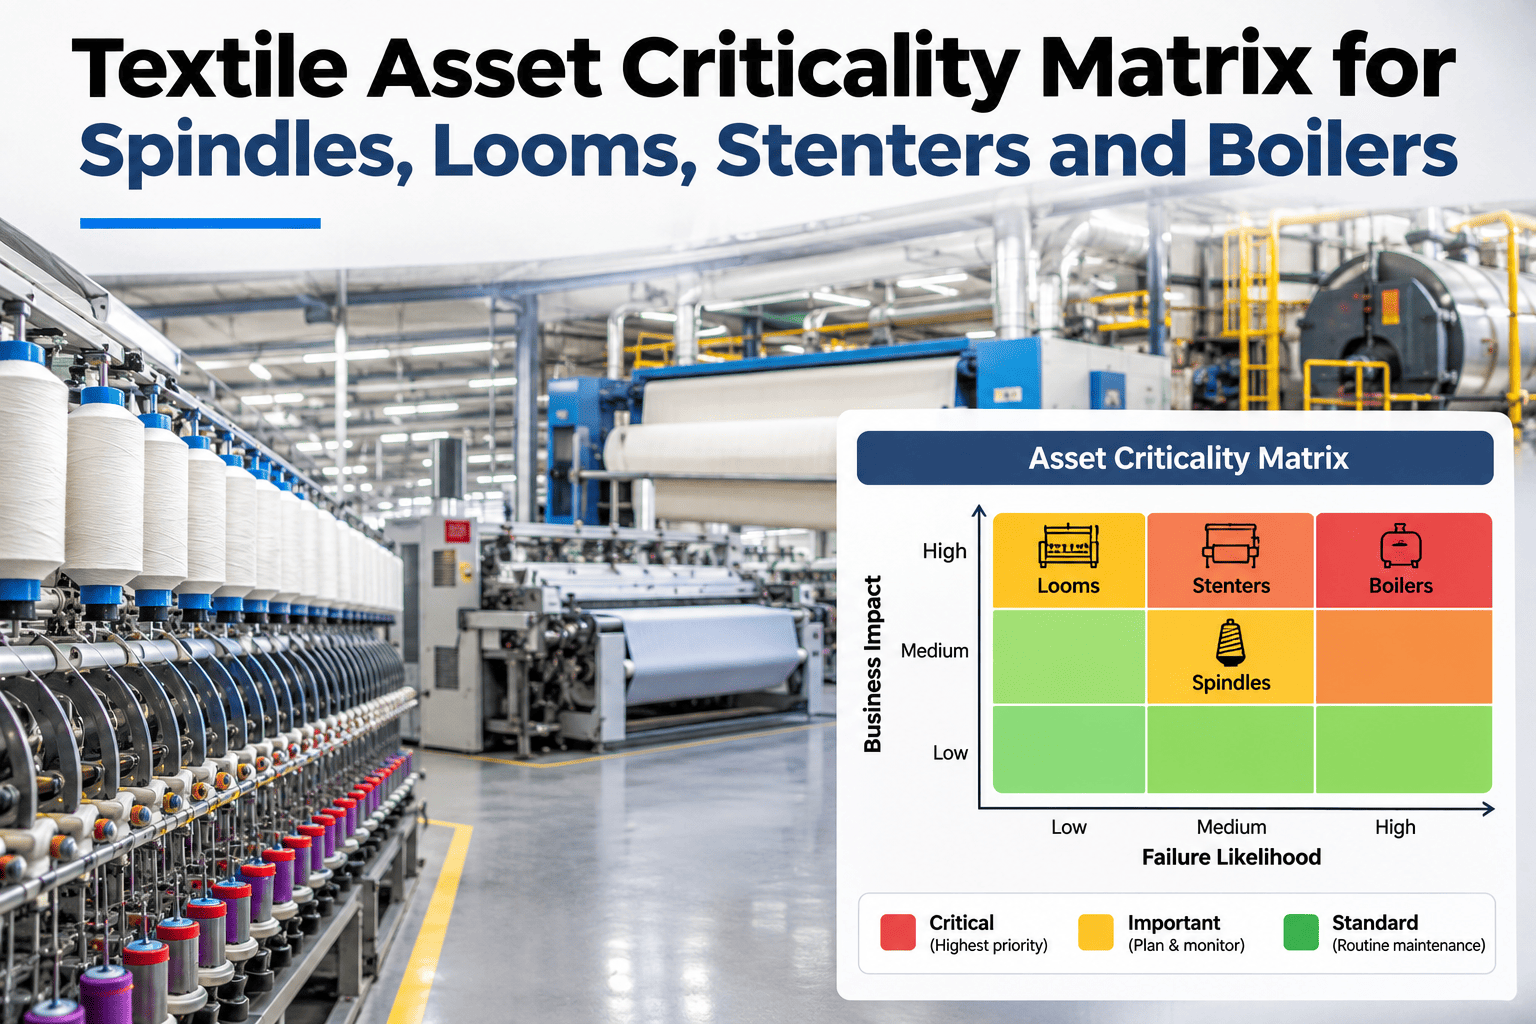
Many textile mills give every machine the same maintenance attention, yet spindles, looms, stenters and boilers carry very different risk. Production impact, quality risk, energy draw, failure frequency and repair cost set how much attention each asset actually deserves. This checklist scores your assets against those five factors so monitoring budgets land where failure actually hurts. Mills that want this scored on their own register can see a live criticality ranking reviewed on real asset data.
Give Every Machine the Attention Its Risk Actually Earns
iFactory AI scores spindles, looms, stenters and boilers across five weighted factors and ranks them so monitoring, spares and skilled hours go where failure actually hurts.
What Asset Criticality Ranking Actually Does
Asset criticality ranking scores each machine against defined risk factors, then orders the plant from most to least critical so maintenance strategy and spares follow the ranking rather than habit. A quarter of a mill's machines typically account for roughly 80% of unplanned downtime — the spinning frames, sizing machines, stenters and boilers the rest of the line depends on.
Five Factors, One Weighted Score
A single number — "it costs a lot to fix" — is never enough on its own. Criticality is multi-dimensional, and the bar shows an illustrative weight each factor carries in the default textile model.
Why Boilers and Stenters Often Outrank the Production Floor
A boiler or stenter failure rarely just stops one machine — it radiates loss into everything downstream and into the energy bill at the same time. The bars show an illustrative split of where a thermal asset's energy actually goes.
See Your Own Assets Ranked by Criticality
Book a 30-minute session and iFactory AI will score your spindles, looms, stenters and boilers against the five-factor model using your own asset and work-order data.
The Four-Stage Scoring Checklist
Work through these stages in order for each production area. A maintenance planner and a production lead can run the full list together in a single shift.
Worked Example: Four Asset Classes Ranked
Below is an illustrative scoring of four textile asset classes. Ratings reflect typical mill behaviour — replace them with your own data once you run the model.
Score 41 · Tier A
Score 41 · Tier A
Score 34 · Tier B
Score 31 · Tier B
Mapping Tiers to Maintenance Strategy
A ranking only earns its keep when each tier gets a different response — that is where the score converts into budget decisions.
Critical — Monitor Continuously
Boilers and stenters. Condition monitoring, anomaly detection, critical spares on site.
Important — Prevent on Schedule
Looms and spindle banks. Structured preventive tasks, targeted sensing on repeat offenders.
Standard — Run and Restore
Low-impact auxiliaries with spare capacity. Light inspection cycle, restore on failure.
Give one person — usually the reliability or maintenance planner — ownership of the ranked list, so tiers don't drift as individual supervisors make their own calls on what counts as urgent.
Signals Worth Watching Between Reviews
These readings tell the maintenance planner when an asset's tier no longer fits its current behaviour, so a re-score can happen on evidence rather than waiting for the next scheduled review.
Five Mistakes That Wreck a Criticality Ranking
Each of these is an easy shortcut that feels reasonable in the moment — and each quietly undoes the discipline the model is supposed to provide.
A Composite Scenario: Fewer Surprises After Ranking
A mill compared twelve weeks of unplanned stops before and after applying the weighted model. Each cell shows how close that week's downtime ran to target, using illustrative results.
Where iFactory AI Fits
Work orders, energy meters and sensor feeds usually live in different systems. iFactory AI joins them asset by asset, so the five-factor score is built from live data instead of an annual spreadsheet exercise.
Live Frequency Scoring
Failure frequency is read from work-order history automatically, not estimated once a year.
Energy Signatures
Per-machine energy use feeds the energy factor for boilers, stenters and dye machines.
Anomaly Flags
Early drift raises an asset's score before it causes a stop or a reject run.
Tier Change Alerts
When behaviour shifts, the tier moves automatically and the planner is notified.
What Data You Need to Start
A first pass doesn't require sensors. Your asset register plus 12 months of work-order history already gives you production impact, failure frequency and repair cost. Energy and quality can start as floor-team estimates and be sharpened once sub-metering or condition monitoring is added.
Frequently Asked Questions
How many assets should end up in the top tier?
Most textile plants settle around 15–25% of registered assets in Tier A once the weighted model is applied consistently. Book a demo to benchmark your split.
Can we start without sensors installed?
Yes — the first pass runs on your asset register and work-order history alone. Book a demo to see a first-pass model.
Why do boilers and stenters often outrank production machines?
They combine high production reach with a high, continuous energy swing that production machines rarely match. Schedule a session to map your thermal assets.
How often should the ranking be refreshed?
At least twice a year, and immediately after any line change. Ask support about automating the refresh.
What's the fastest way to start without over-engineering it?
One production area, five factors, three tiers, then act. Book a working demo for a guided first pass.
Rank Your Assets Before the Next Unplanned Stop Does It for You
iFactory AI turns your asset register and work-order history into a weighted criticality ranking and a monitoring plan matched to it.