A textile mill that tracks its own KPIs in isolation has no way to know whether a 2.1% yarn break rate is excellent or acceptable for its count mix and machine age. Benchmarking gives that number a context — by comparing it against external industry norms, internal best-shift performance, or sister-plant standards. The challenge in textile manufacturing is that published benchmarks are often too broad to be actionable: a "global textile OEE average" means nothing if your mill runs ring spinning on 40s count in a humid coastal climate. Useful benchmarking is specific to machine type, count range, process, and production profile. Teams that want to build a benchmarking framework matched to their actual operation can review a benchmarking setup with iFactory AI's textile analytics team.
Build Benchmarks That Actually Mean Something for Your Mill
iFactory AI creates comparable benchmarks for machine reliability, yarn quality, energy intensity, dyeing RFT, maintenance performance and production losses — segmented by machine type, count, process and shift.
What Is Textile Performance Benchmarking?
Textile performance benchmarking is the process of comparing a mill's operational KPIs — machine reliability, yarn quality, energy consumption, dyeing efficiency, and maintenance cost — against a defined reference standard to identify performance gaps and improvement priorities. A benchmark is only useful when it is specific: the right reference for a ring spinning machine running 40s combed cotton is not the same as the right reference for open-end spinning on 20s carded cotton.
Why Generic Industry Benchmarks Mislead Textile Mills
Published textile benchmarks are averaged across diverse mills, geographies, and machine generations. Applying a global average to a specific machine or count produces misleading conclusions.
Machine Reliability Benchmarking Framework
Machine reliability benchmarking in a textile mill covers availability, mean time between failures (MTBF), mean time to repair (MTTR), and OEE. The framework below defines each metric and its benchmark reference for key textile machines.
| Machine | Reliability KPI | Internal benchmark reference | External benchmark reference |
|---|---|---|---|
| Ring frame | Spindle efficiency %, yarn break rate | Best 5 machines this month | SITRA norms by count group (SITRA, 2025) |
| Draw frame | Uptime %, CV% at output | Best shift this quarter | OEM specification at standard load |
| Dyeing machine | MTBF, cycle efficiency %, RFT rate | Best machine same shade family | BTRA textile norms; supplier benchmarks |
| Stenter | Uptime %, energy per kg, temperature stability | Best week this year | OEM energy specification at design speed |
| Autoclave / heat-setter | Uptime %, steam per batch, cycle deviation | Lowest-cost batch in last 6 months | Supplier process guideline |
Set Up Machine-Level Reliability Benchmarks for Your Mill
iFactory AI deploys on-premise and calculates machine reliability benchmarks automatically — segmented by machine, count, shift, and product type.
Yarn Quality Benchmarking: Uster Percentile System
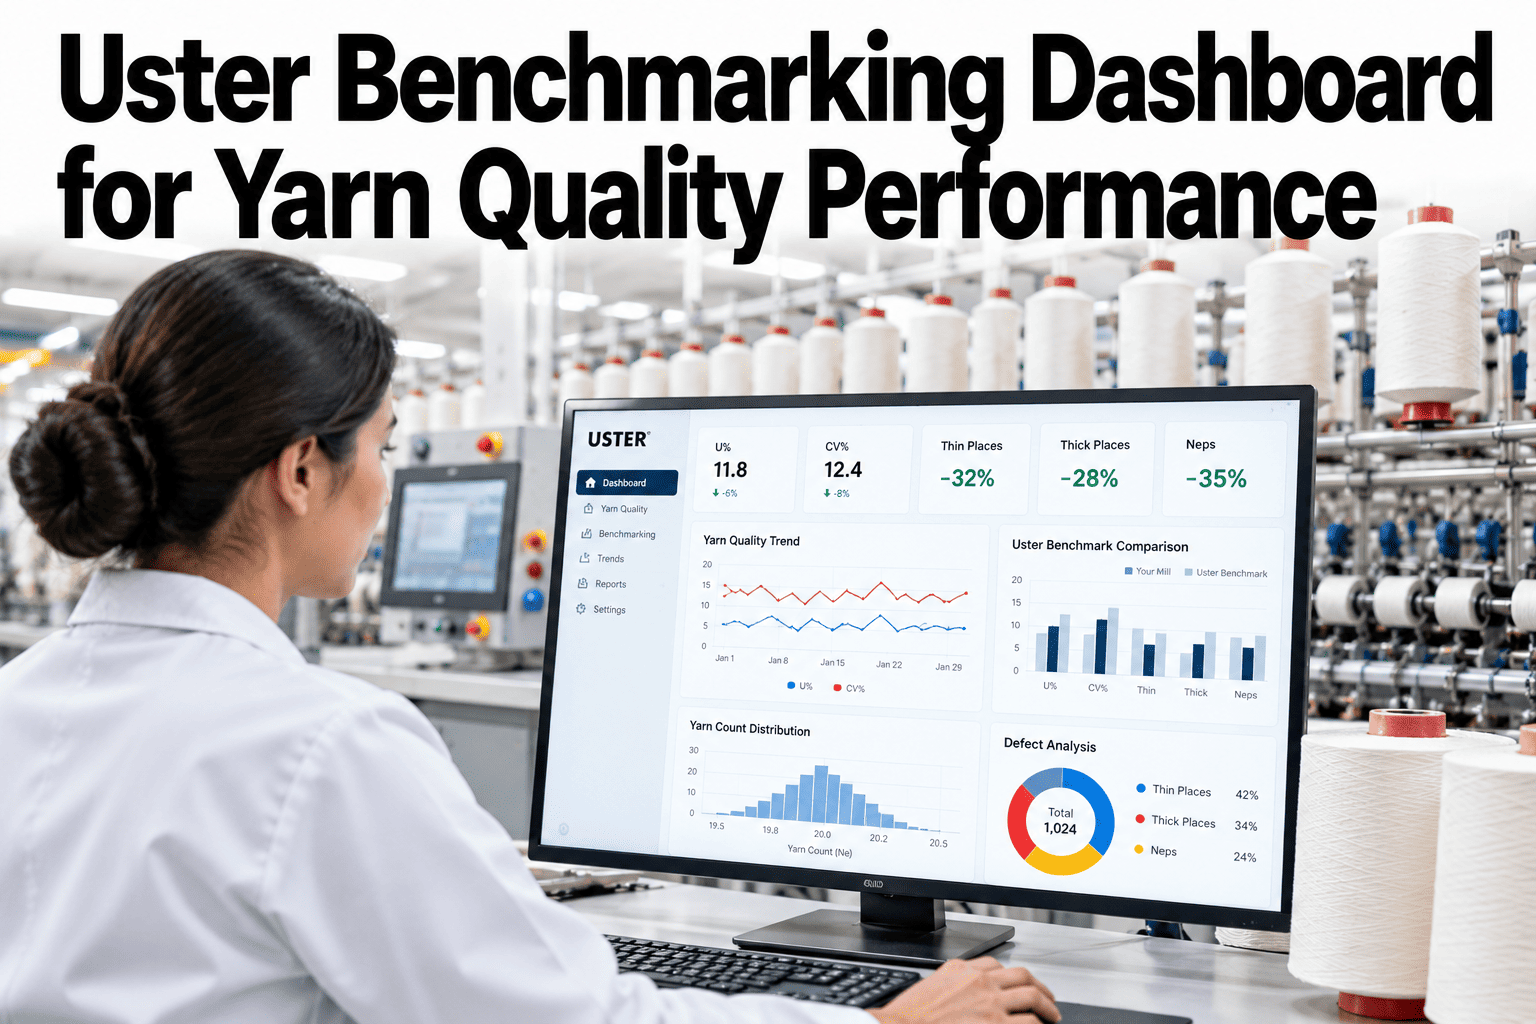
The Uster Statistics system (updated 2025) provides the most widely used external benchmark for yarn quality in the textile industry. It reports CV%, thin places, thick places, neps, and hairiness at the 5th, 25th, 50th, 75th, and 95th percentile for each yarn count and fibre type, based on thousands of mill submissions globally.
iFactory AI stores Uster test results against their machine and count context, automatically plots them against Uster Statistics percentile bands, and flags machines whose output is trending toward a worse percentile before complaints arrive. See how Uster percentile benchmarking works in a live walkthrough.
Energy Benchmarking: Textile Mills vs Global Intensity Norms
Energy intensity benchmarking for textile mills compares a mill's kWh per kg (or GJ per tonne) against published norms from industry bodies and equipment manufacturers. The International Energy Agency (IEA, 2025) publishes textile sector energy intensity data by region and sub-sector, and the Bureau of Energy Efficiency (BEE) in India publishes norms for spinning, weaving, and processing mills.
Maintenance Performance Benchmarking
Maintenance benchmarking in textile mills covers four dimensions: cost, response time, compliance with preventive maintenance schedules, and the ratio of planned to unplanned work. Industry research consistently shows that mills with more than 70% planned maintenance experience significantly lower unplanned downtime costs (Plant Engineering, 2025).
Teams using iFactory AI can access their PM compliance rate, planned-to-unplanned ratio, and MTTR automatically from CMMS work order data — updated daily without manual calculation. Ask how iFactory AI's CMMS module tracks maintenance benchmarks for textile mills.
Frequently Asked Questions
How do we set internal benchmarks when our best historical performance was under different conditions?
Use a normalised internal benchmark: identify the best-performing period and adjust for the variables that differ — count mix, ambient humidity, utilisation rate — using simple ratios. This gives a like-for-like reference that is achievable under current conditions. iFactory AI calculates normalised benchmarks automatically once the adjustment variables are defined. See how normalised benchmarking works in a live walkthrough.
Should we use Uster Statistics as our primary yarn quality benchmark?
Uster Statistics is the right external reference for yarn quality, but it should be used at the right percentile for your market. If you sell to a commodity market, the 50th percentile is an appropriate target. If you supply premium knitters or weavers, you need 25th percentile or better on the critical parameters. Always supplement Uster data with customer complaint history — an Uster 30th percentile mill that generates frequent shade or weaving complaints has the wrong set of benchmarks. Ask how iFactory AI maps Uster data to customer complaint history.
How often should textile benchmarks be reviewed and updated?
Internal benchmarks should update monthly — your best-performer will improve as the team responds to data. External benchmarks should be reviewed annually when new Uster Statistics or BEE/IEA norms are published. OEM-specified benchmarks rarely change but should be reviewed after major overhauls or when running at a significantly different count or speed than when originally specified. Book a session to set up automated benchmark refresh in iFactory AI.
Can a small mill with 10,000 spindles benefit from formal benchmarking?
Yes — in fact, internal benchmarking is more valuable for a smaller mill than external benchmarks because the gap between best and worst machine is a direct, actionable improvement opportunity. A 10,000-spindle mill where the top-performing ring frame runs at 2.1 breaks/1,000 spindle hours and the worst runs at 4.8 breaks has a clear, costed improvement target without needing any external reference. iFactory AI is designed for mills of all sizes and deploys on a single NVIDIA server regardless of spindle count. Ask our team how the platform scales to smaller mills.
What is the right benchmark for dyeing RFT in a mill running both reactive and disperse dyes?
Reactive and disperse dye processes have different inherent RFT ranges, so they should be benchmarked separately. Reactive dyes on cotton are more sensitive to water chemistry and temperature deviations, typically yielding 88–93% RFT without tight process controls. Disperse dyes on polyester are more process-stable and can achieve 93–97% RFT in well-controlled conditions. Combining them into one RFT number hides which process family is driving failures. See how iFactory AI segments dyeing RFT by dye class and machine.
Build Benchmarks That Drive Decisions, Not Debates
iFactory AI creates textile benchmarks segmented by machine, count, shift, and process — deployed on-premise on your mill's NVIDIA server, live within 6–12 weeks.