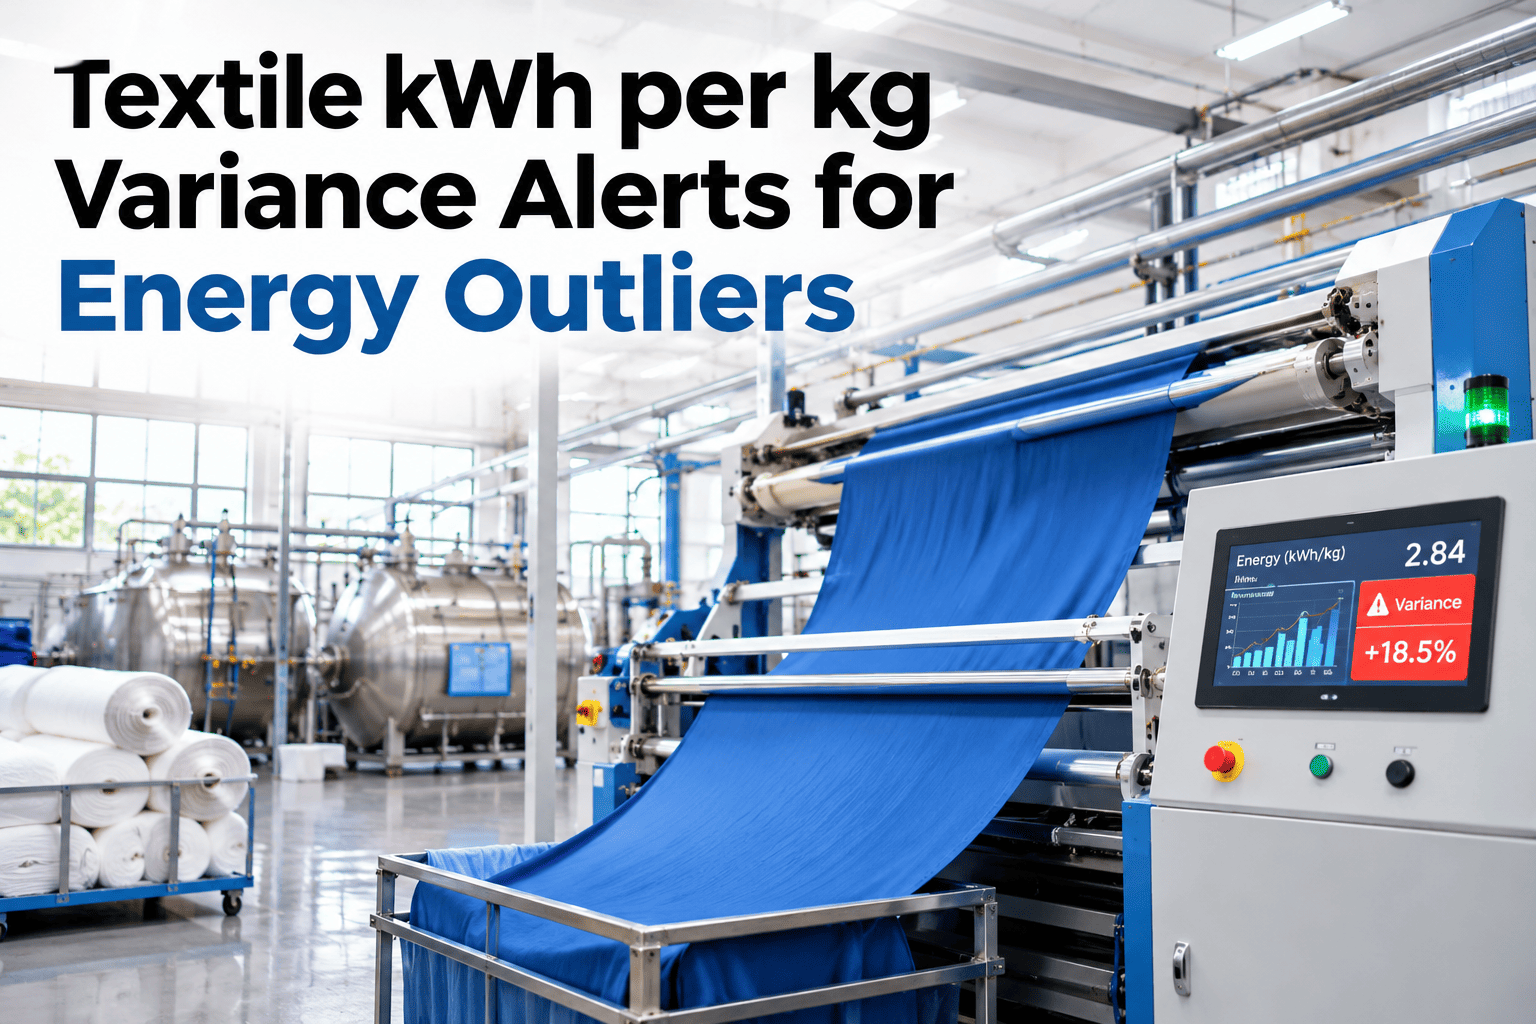
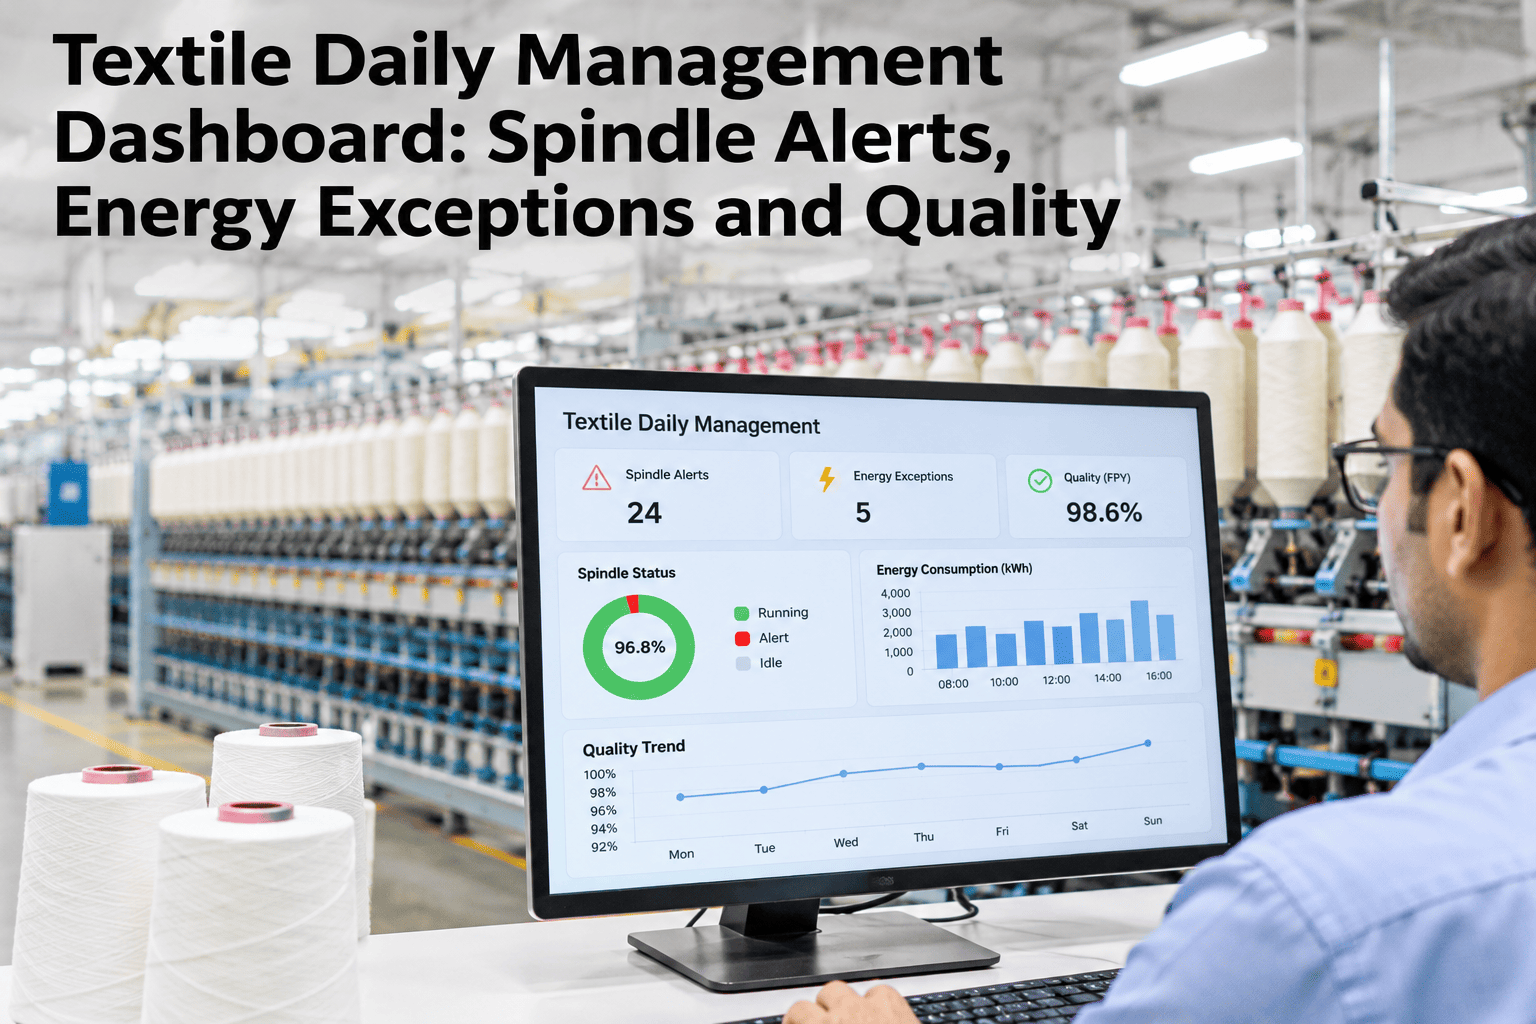
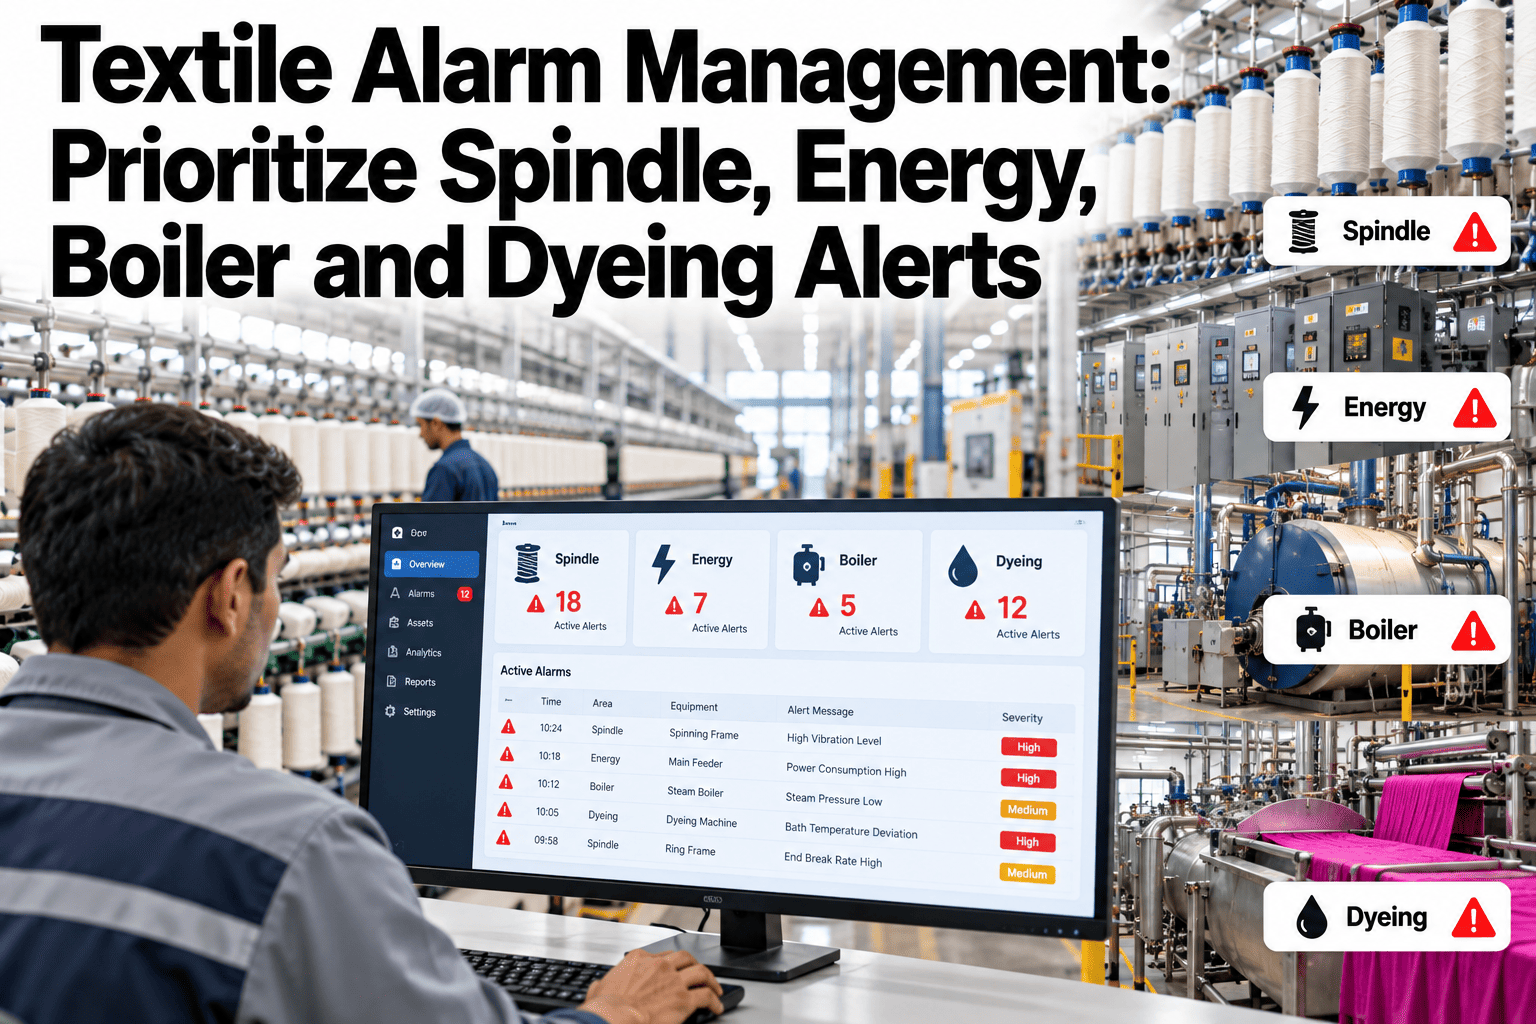
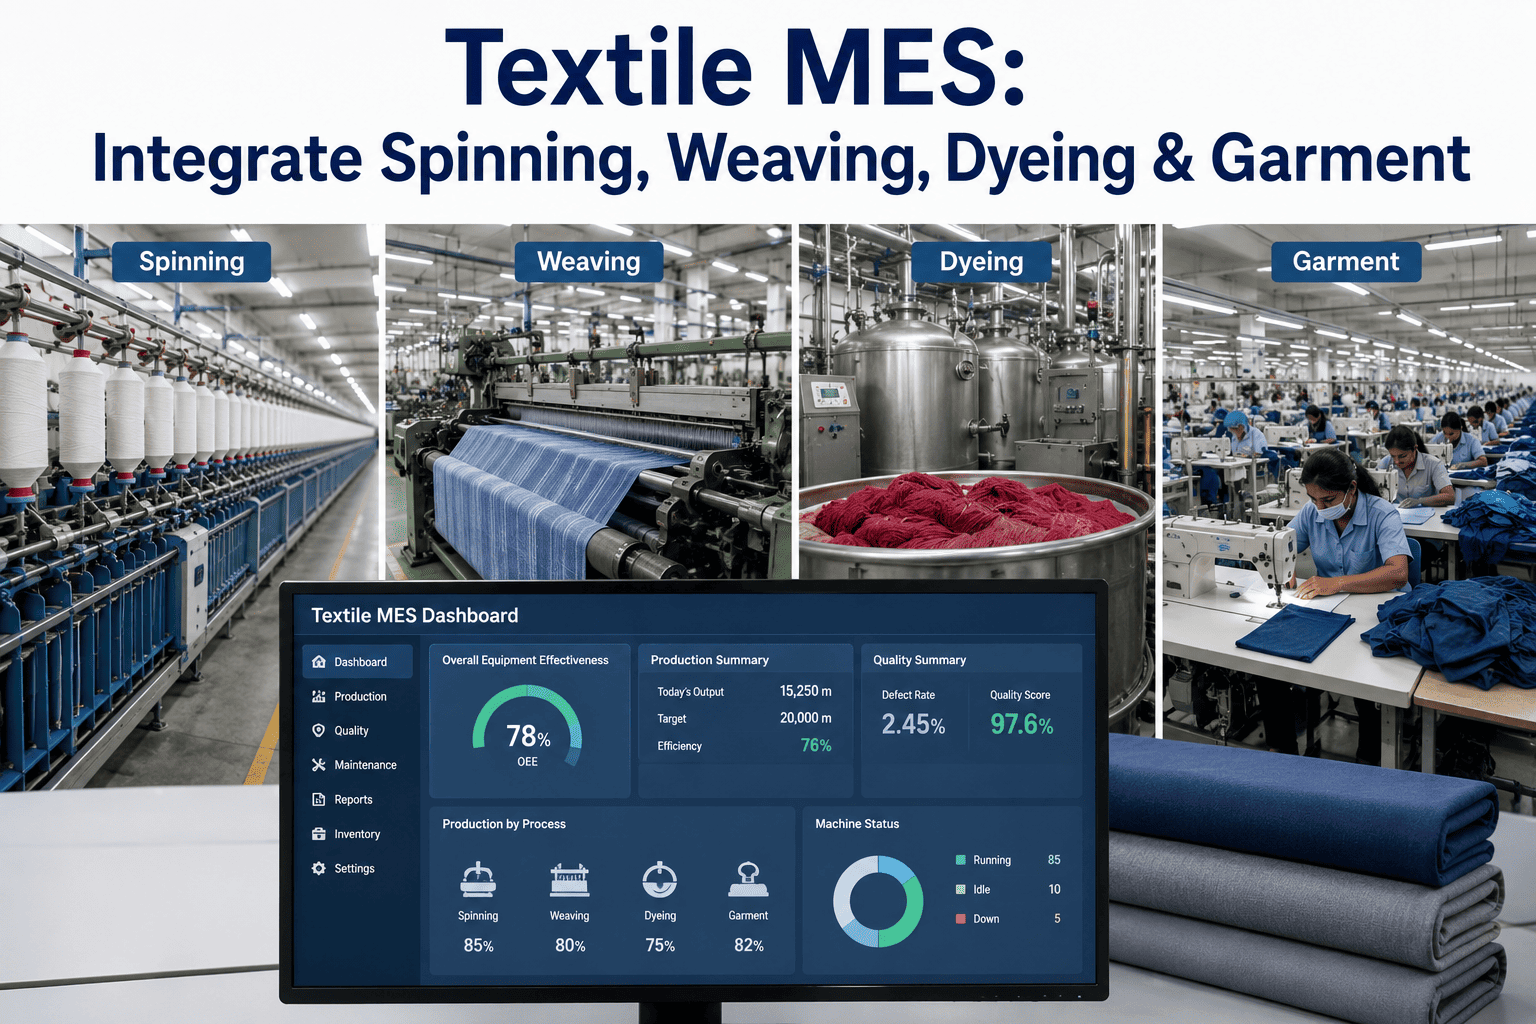
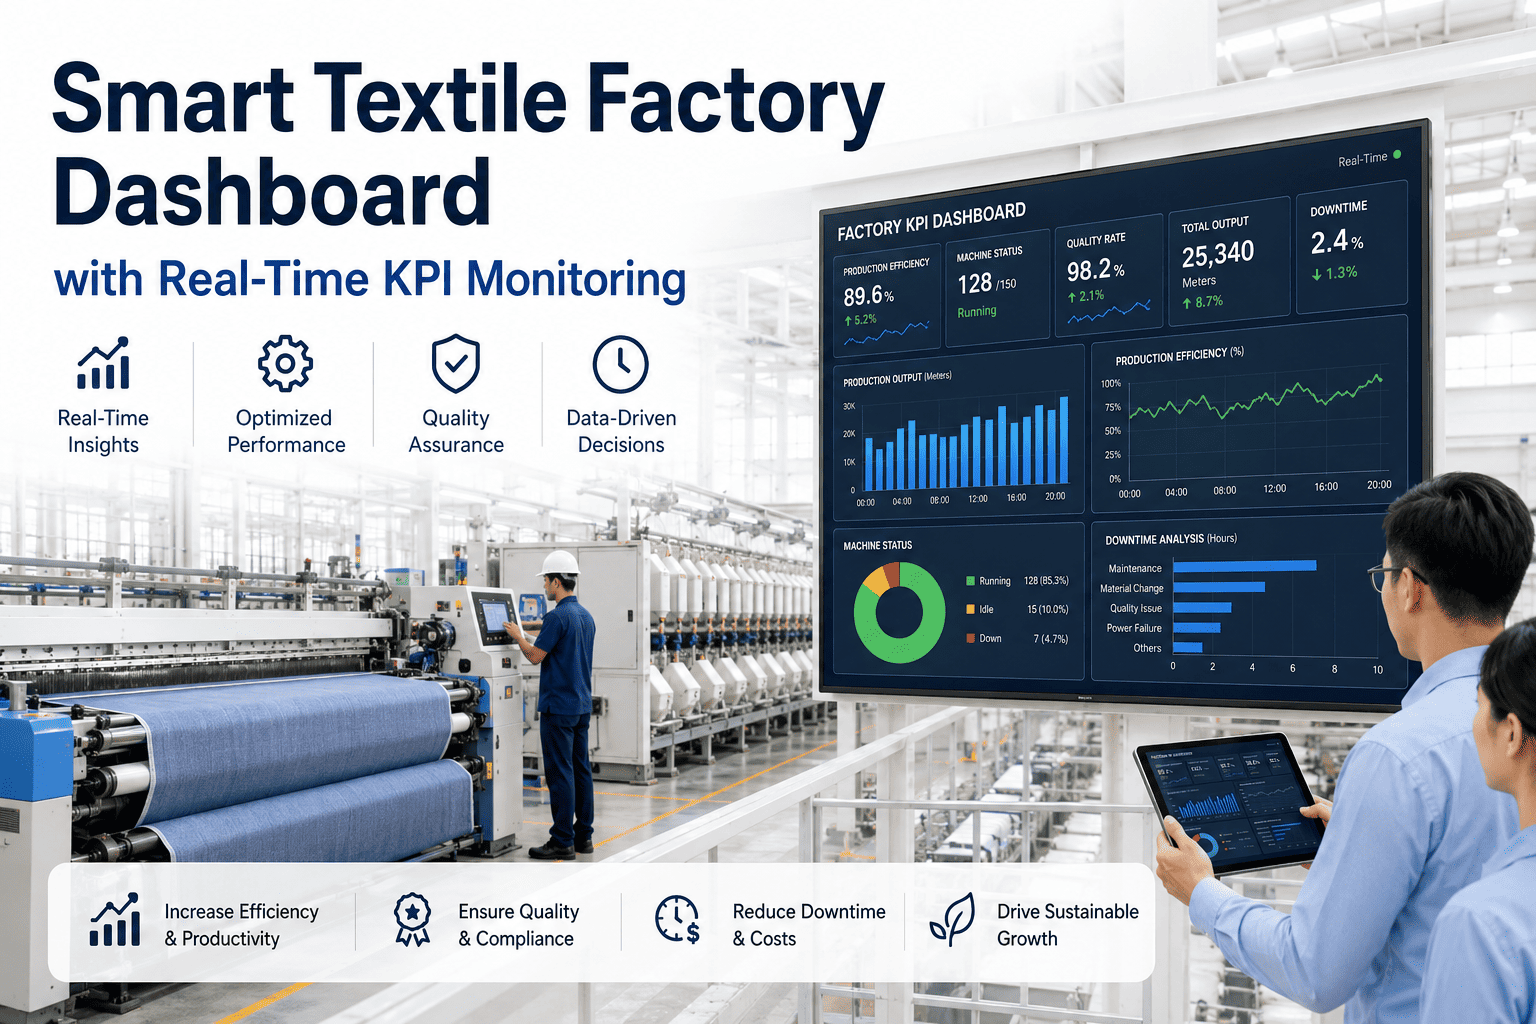
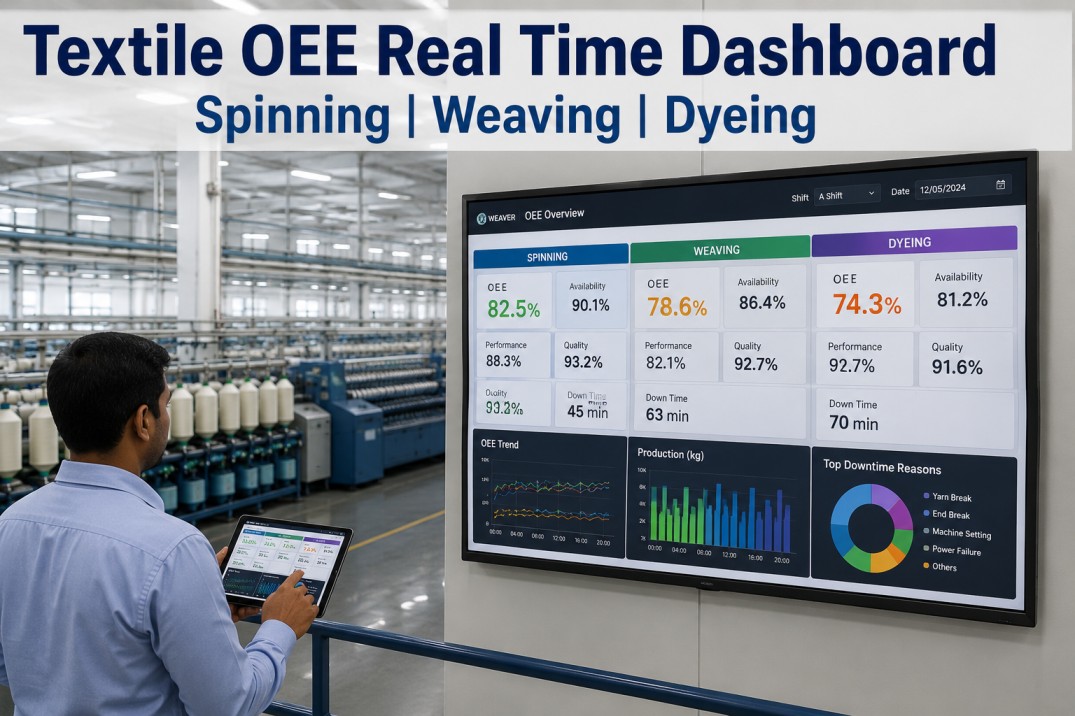
Specific energy consumption — kWh per kg of output — is the standard way textile mills normalize energy use across different production volumes, but a single plant-wide average hides exactly where the waste is coming from. iFactory, an on-premise AI platform with energy monitoring built in, tracks kWh per kg by machine, department, and product, flagging outliers automatically. Energy teams who want this visibility on their own mill can request a demo with our team.
kWh per kg Variance Alerts · Textile Energy, 2026
One Plant-Wide Average Hides Every Outlier Underneath It
iFactory AI tracks specific energy consumption at the machine and department level, flagging the outliers a single blended number would never reveal.
Dyeing — Machine 44.3 kWh/kg
Why a plant-wide average hides outliers
Averages Smooth Out Exactly What You Need to See
A mill-wide kWh per kg figure blends the efficient equipment with the inefficient, and the inefficient outlier simply raises the average slightly rather than announcing itself. Breaking the same consumption data down by machine and product is what actually reveals that one dyeing machine, one shift, or one product recipe is consuming disproportionately more energy per unit of output than its peers.
What drives a kWh/kg outlier
Four Common Root Causes Behind a Flagged Variance
Equipment degradation
A motor, pump, or heating element losing efficiency over time without a sudden failure.
Underloaded batches
A machine run below its efficient capacity consumes nearly the same energy for less output.
Process deviation
A longer-than-standard cycle time or an extra reheat step inflates energy per unit.
Product mix shift
A naturally more energy-intensive product run can look like an outlier if not normalized by product type.
Setting a meaningful baseline
What "Normal" Needs to Account For
| Baseline factor | Why it matters |
|---|
| Product type | Different fabrics and processes have genuinely different energy intensity |
| Batch size | Smaller batches carry proportionally higher fixed energy overhead |
| Machine-specific history | Each machine's own baseline, not a generic plant-wide number, is the right comparison |
| Seasonal conditions | Ambient temperature can shift thermal energy needs independent of any real inefficiency |
See Which of Your Machines Are Already Outliers
Share your current energy and production data by machine, and iFactory AI will show where the outliers are hiding in your plant-wide average.
From alert to action
Four Steps From a Flagged Outlier to a Resolved Cause
1
Variance crosses threshold
A machine's kWh per kg moves meaningfully above its own established baseline.
2
Context is checked
Product type, batch size, and recent maintenance history are reviewed against the flag.
3
Root cause investigated
If the context doesn't explain it, the equipment or process itself is investigated directly.
4
Baseline confirmed or updated
A genuine fix returns the metric to baseline; a legitimate new normal updates the baseline itself.
Avoiding false alarms
Not Every Variance Is a Problem
A single elevated reading after a changeover, or during a genuinely heavier fabric run, isn't necessarily a fault — the goal is flagging a sustained deviation from a machine's own realistic baseline, not reacting to every single data point that drifts above a generic plant-wide number.
Expert review
What an Energy Manager Checks First
kWh per kg variance alerting earns trust when the baseline is specific enough to each machine and product that a flagged variance actually points to something real.
Verdict
Strong when product type and batch size are normalized into the baseline, not left to create noise.
Watch for
Treating every above-average reading as a fault when some variation is simply the normal range for a specific product.
Do next
Break your last month's plant-wide kWh per kg figure down by machine and see how wide the spread actually is underneath the average.
Frequently asked questions
What Energy Teams Ask About kWh/kg Variance Alerts
What metering do we need in place before this works?
Machine-level or department-level submetering is the main requirement — a single plant-wide meter can't support the breakdown needed to flag individual outliers.
Discuss your current metering setup.
How is a genuine fault distinguished from a naturally energy-intensive product run?
How quickly can an outlier be flagged after it starts?
Detection speed depends on how often energy and production data are logged — machines with continuous metering can be flagged much sooner than those relying on periodic manual readings.
Discuss detection speed for your metering.
Can this help justify a motor or equipment upgrade?
Yes — a sustained, documented variance that can't be explained by product mix or batch size is exactly the kind of evidence that supports a targeted equipment investment decision.
Ask support about building an upgrade case.
Does seasonal temperature change throw off the alerts?
Thermal processes in particular can shift with ambient temperature, so a well-built baseline accounts for seasonal variation rather than treating every winter reading as an anomaly.
Talk through seasonal baseline adjustment.
Find the outlier hiding in the average
Track kWh per kg by Machine, Not Just by Plant
Book a demo to see how iFactory AI flags energy outliers across your mill before they compound into a larger bill.