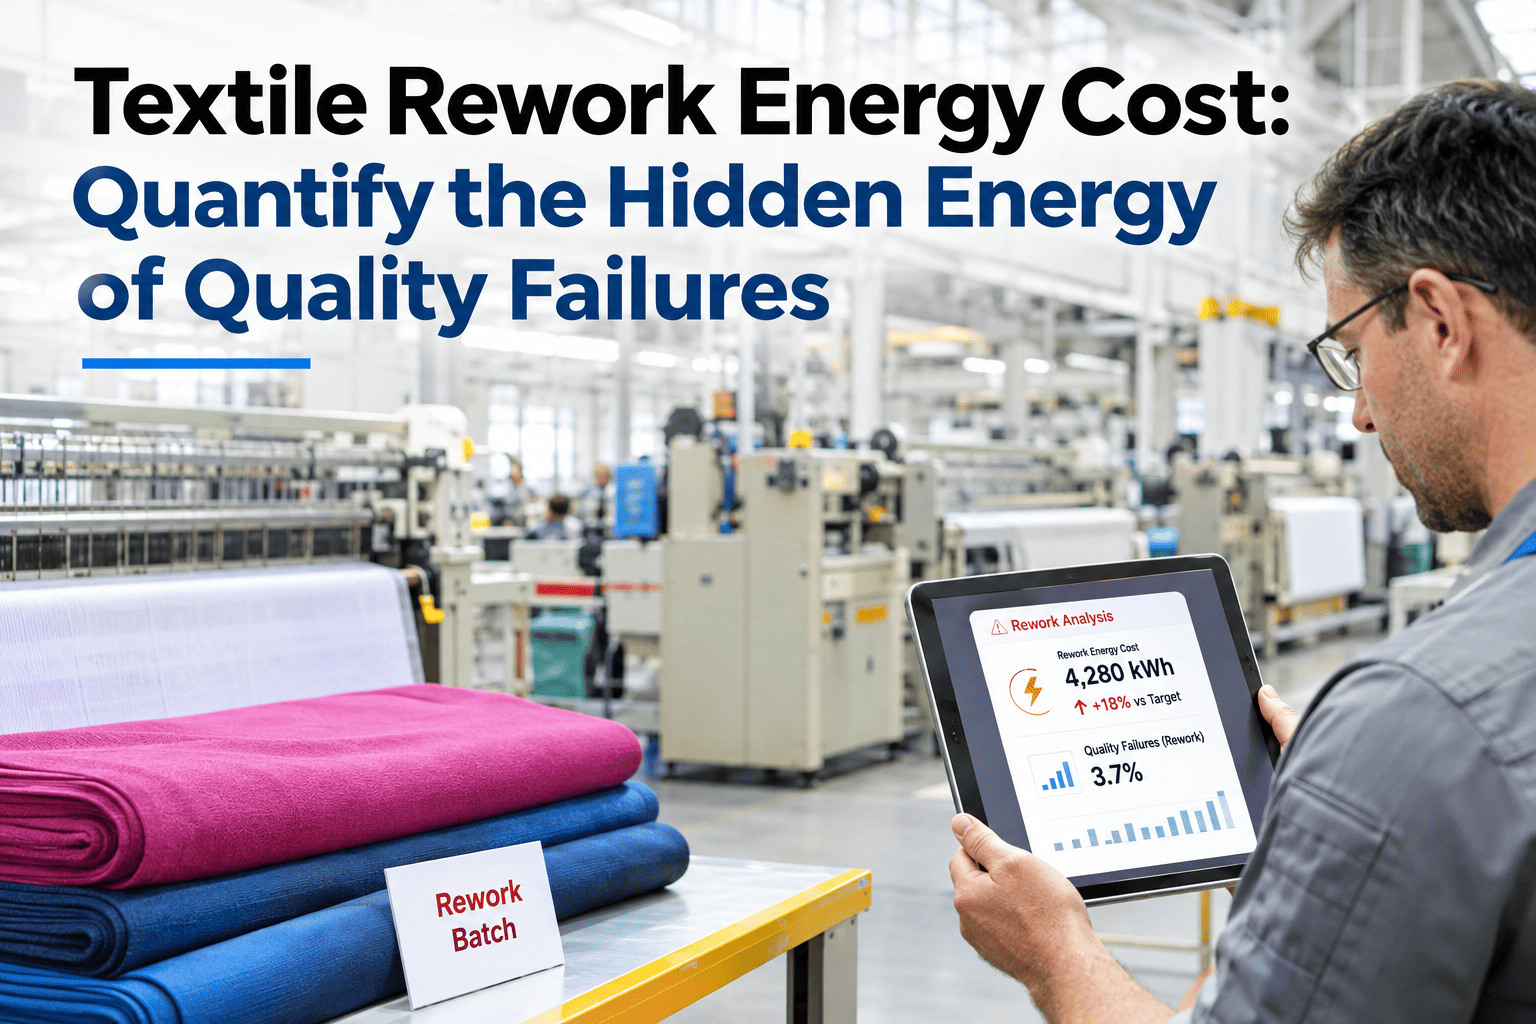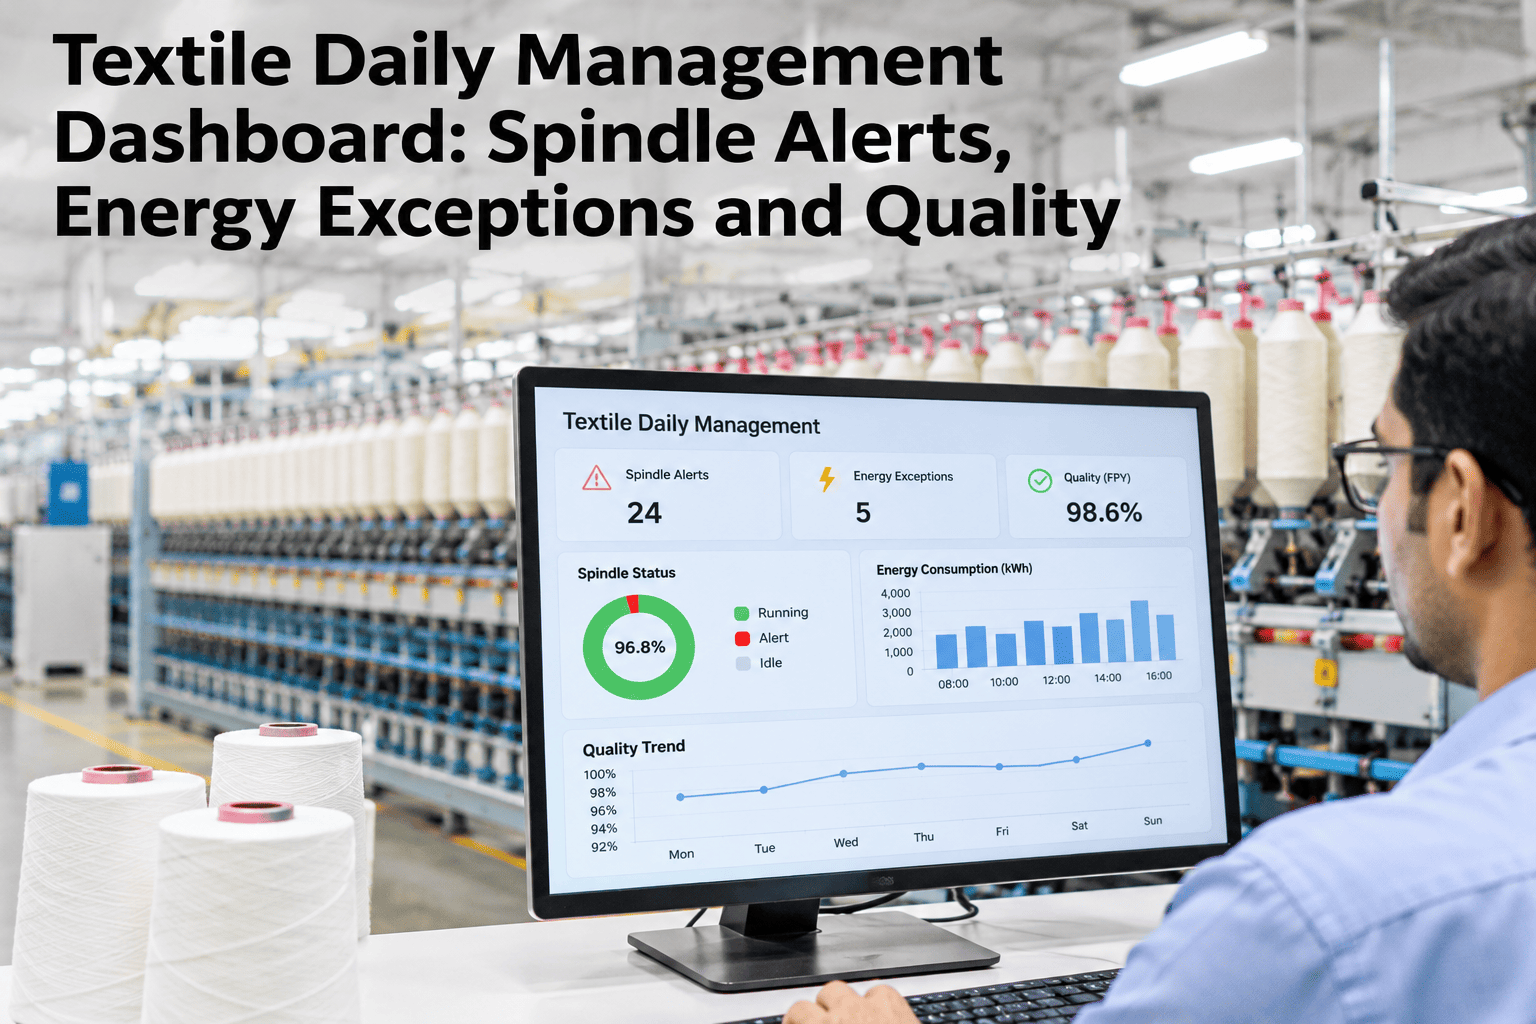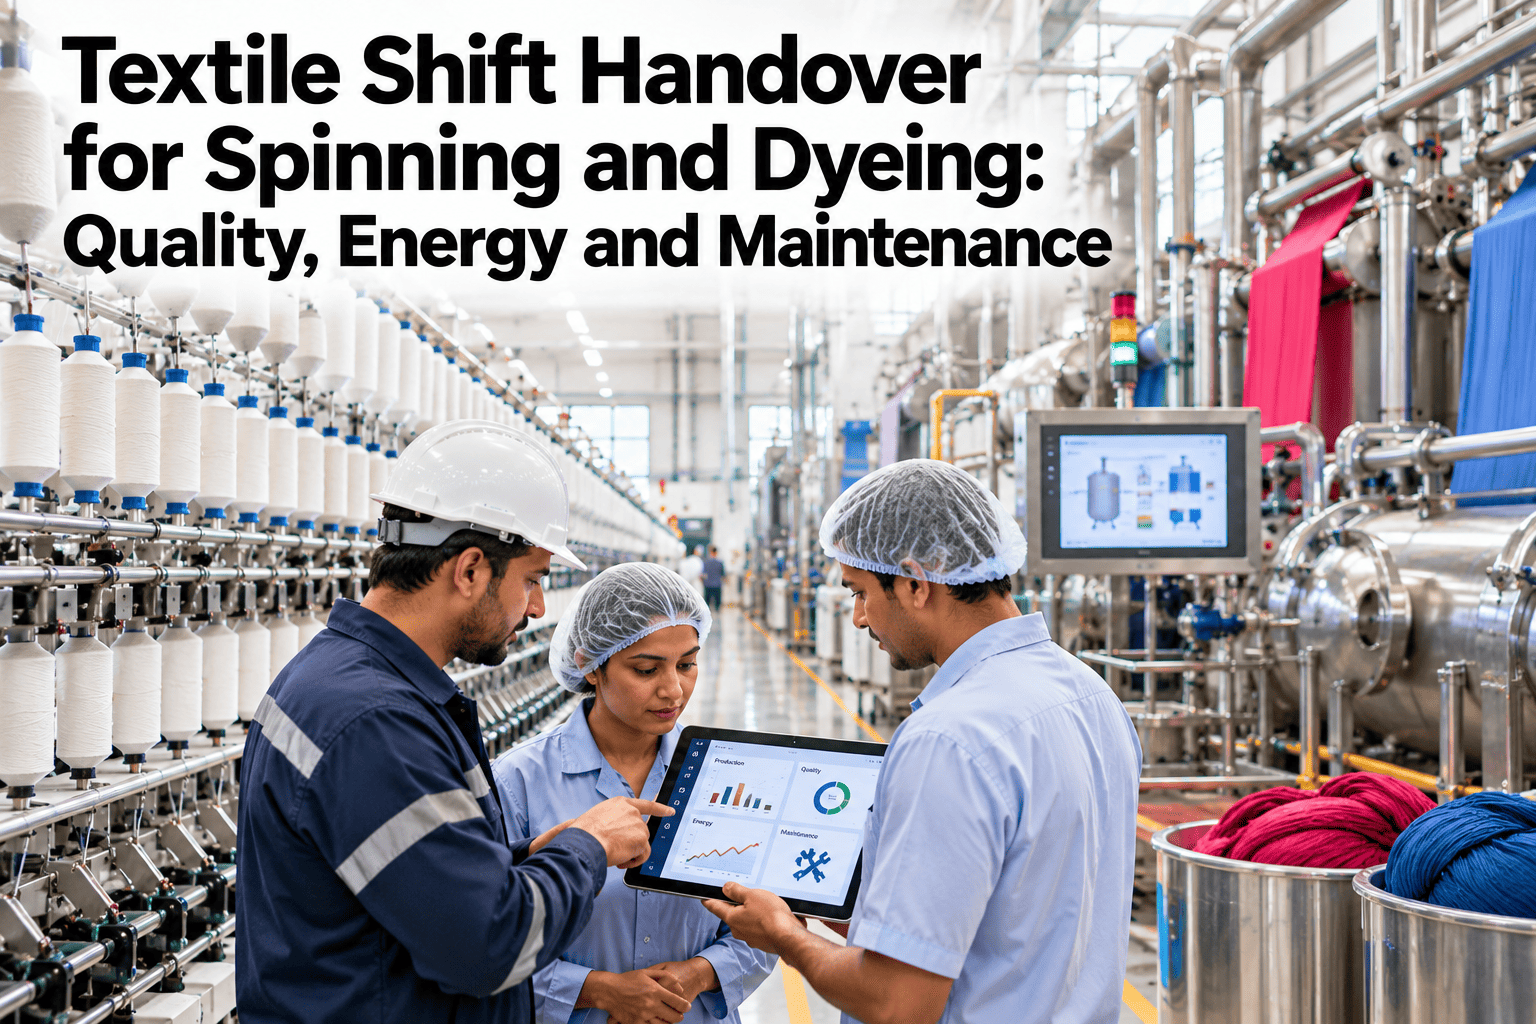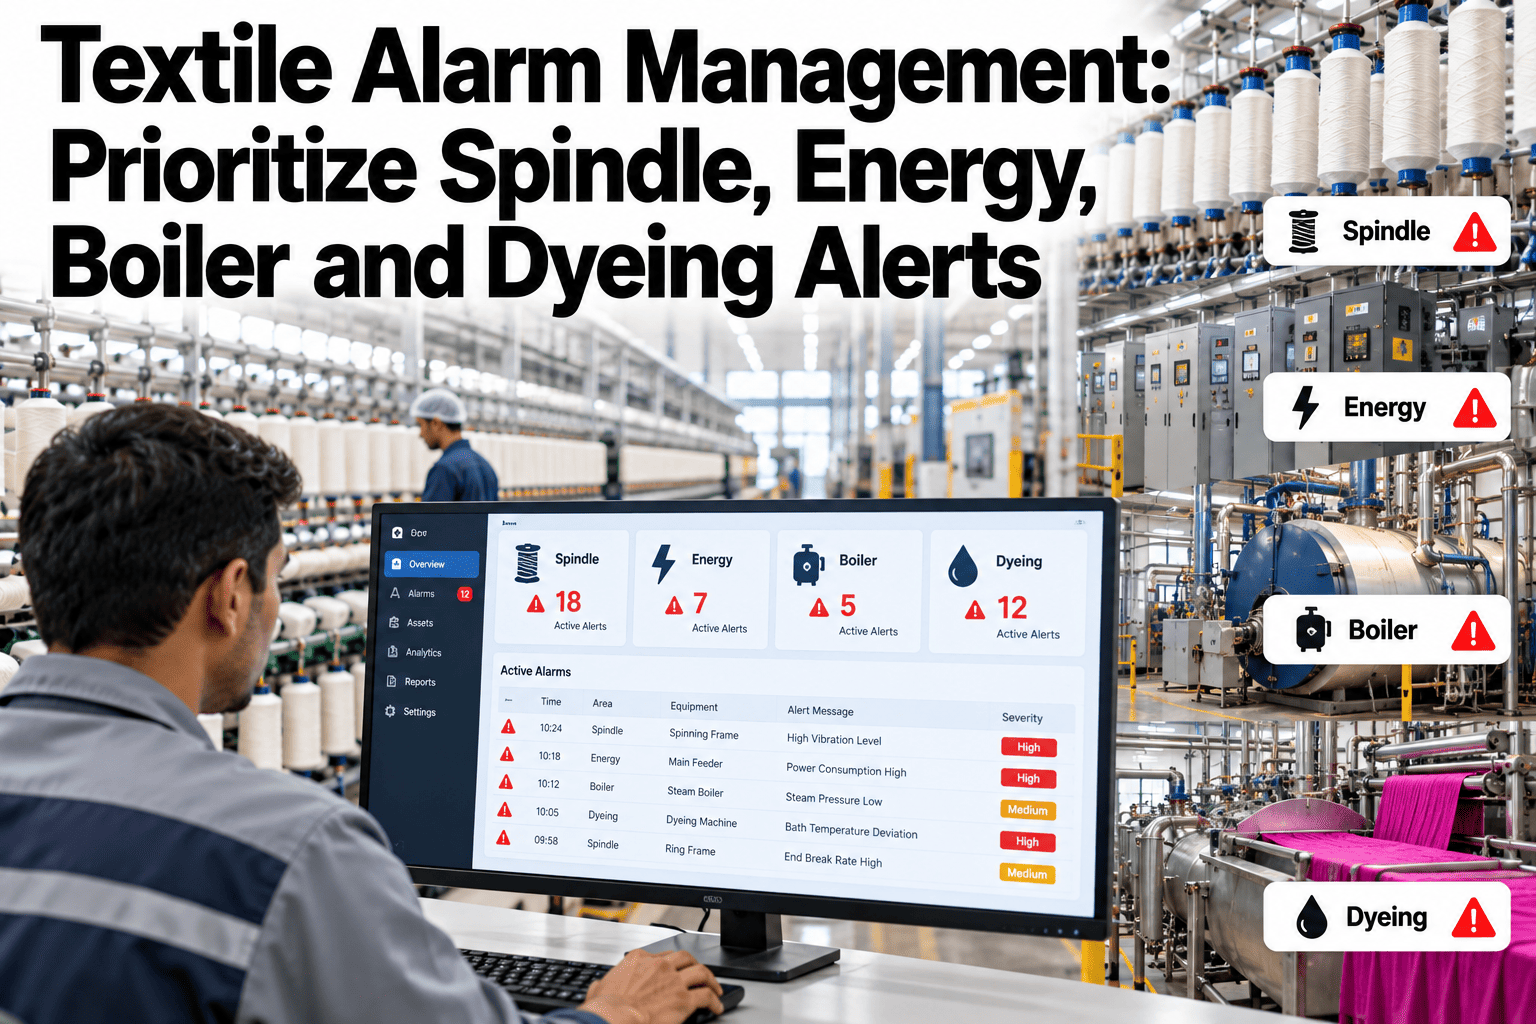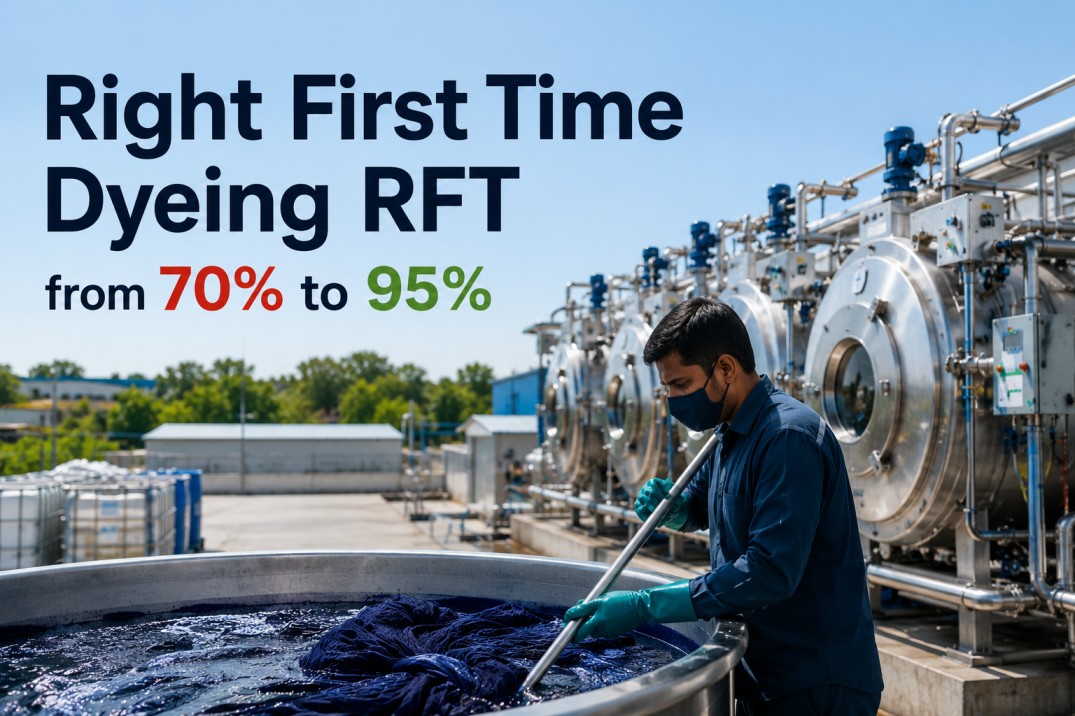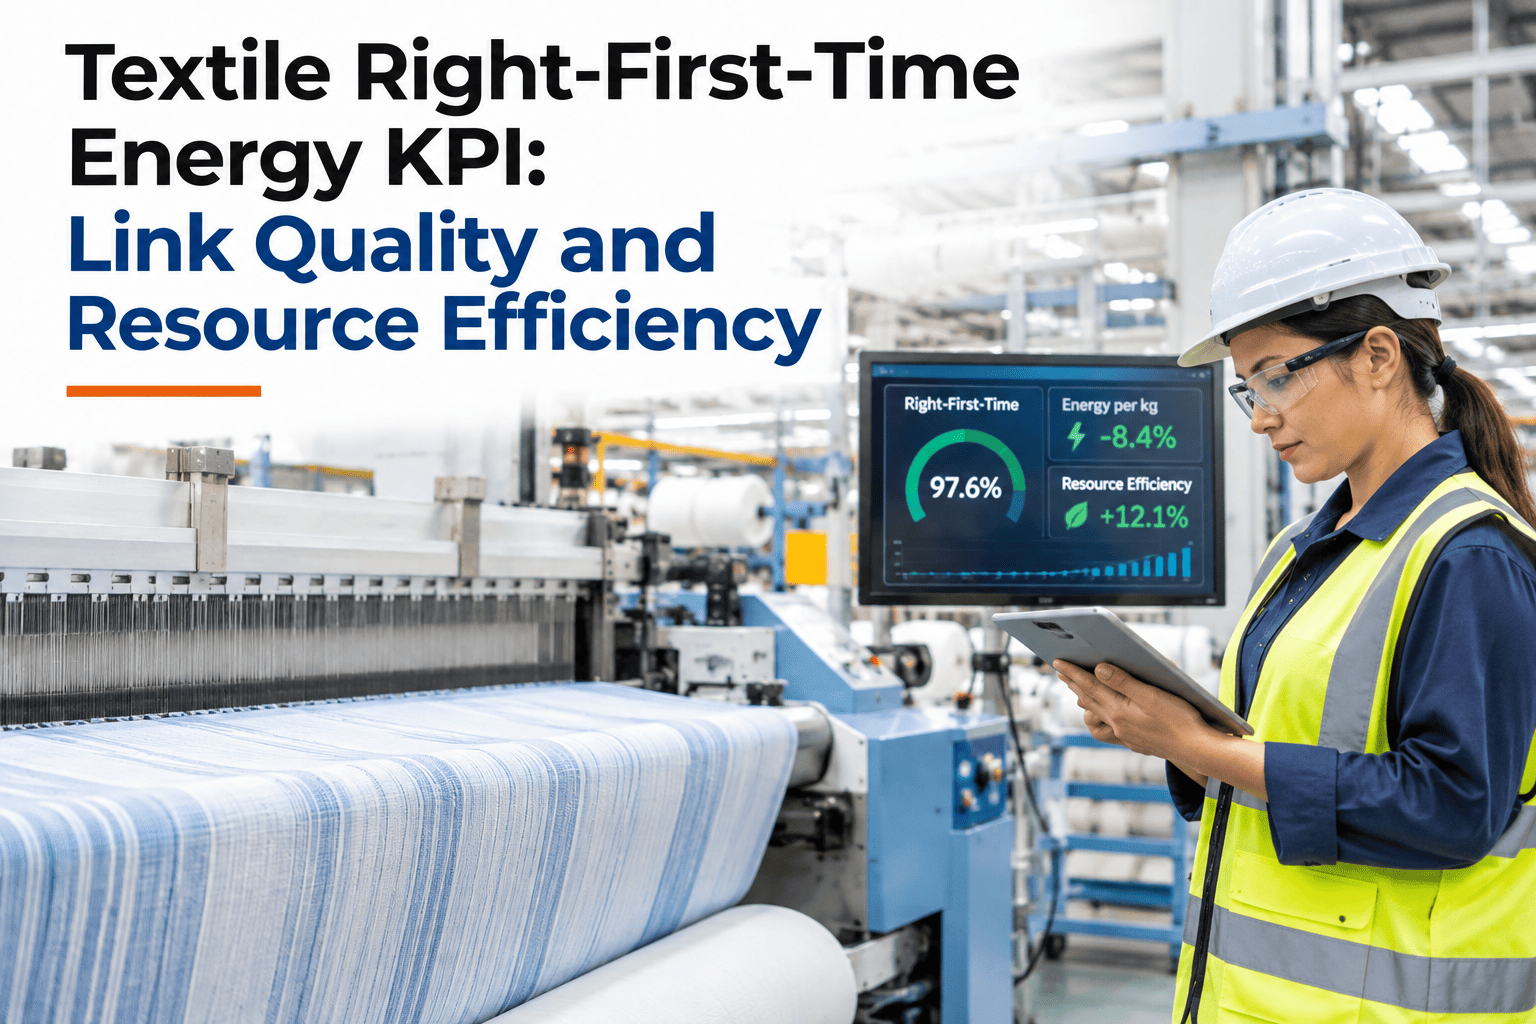
Right-first-time is a quality metric. It tells you what fraction of batches passed on the first attempt. It does not tell you what it cost in energy and resources when they did not. When you combine the two — right-first-time rate with per-batch steam, electricity, water, and chemical consumption — you get a metric that quality and energy managers can both act on. A 1% improvement in RFT rate in a mid-sized dye house running 50 batches per day can eliminate five re-dye events per week, each carrying a full second-cycle thermal cost. That is a measurable, recurring saving with a direct line to the sustainability report as well as the energy bill. iFactory AI makes this calculation automatic — connecting quality outcomes to resource consumption so that every percentage point of RFT improvement shows its energy and cost equivalent in real time.
Right-First-Time Is a Quality Metric. Make It an Energy Metric Too.
iFactory AI links RFT rate to per-batch steam, electricity, water, and chemical consumption — so quality improvement programmes show their resource savings, not just their defect reductions.
Poor
Typical
Best-in-class
What Is the Textile Right-First-Time Energy KPI?
The right-first-time (RFT) energy KPI measures how much energy, water, and chemicals are consumed per unit of confirmed first-pass production — as opposed to energy per unit of total production, which includes rework. It is calculated by multiplying the rework rate by the per-event resource cost and expressing the result as an energy and cost premium per kg or per metre of output.
When this premium is tracked weekly and trend-plotted alongside the RFT rate, the energy benefit of every quality improvement becomes directly visible. A team that raises RFT from 85% to 90% over a quarter can read off the exact steam and cost saving from the same chart — which is a compelling input to both the sustainability report and the capital allocation for quality improvement.
Why Should Quality Teams Track an Energy KPI?
Quality teams measure defect rates, re-dye frequency, and shade deviation. Energy teams measure kWh/kg and steam intensity. These two perspectives rarely share a dashboard — but they are describing different sides of the same event. When a quality failure triggers a rework batch, it simultaneously creates an energy event. Keeping these measurements separate means neither team has the full picture.
Teams who want to quantify the energy cost of their current RFT rate before committing to any improvement programme can run a RFT energy impact assessment with iFactory AI's textile analytics team.
Every Percentage Point of RFT Has an Energy Price Tag. Know Yours.
iFactory AI calculates the steam, electricity, and resource cost of your current RFT rate — and projects what a 5% improvement would save. Book a session to see the numbers on your own data.
How to Build a Textile RFT Energy KPI in Practice
Building the KPI does not require new instrumentation in most cases — it requires a data join that most mills do not currently make. The five inputs needed are all usually available in existing systems; the work is in connecting them.
RFT Energy KPI vs Standard Quality Metrics — What Each Shows
Standard quality metrics tell you how many failures occurred. The RFT energy KPI tells you what each failure cost in resources. The table shows what each metric reveals and where it has a blind spot.
| Metric | What it shows | What it misses | Who uses it |
|---|---|---|---|
| Re-dye rate (%) | Frequency of quality failures | Cost per failure event; energy impact | Quality manager |
| kWh per kg (gross) | Total energy intensity | How much is rework vs productive | Energy manager |
| Cost of Poor Quality (COPQ) | Financial cost of failures | Often excludes energy and water cost | Finance / management |
| RFT Energy KPI (iFactory AI) | Energy and resource premium per kg from quality failures | Nothing — integrates all four above | Quality + energy + operations |
Illustrative Impact of RFT Improvement on Textile Energy Consumption
The following scenario illustrates the energy impact of improving RFT rate in a mid-sized exhaust dyeing operation. All figures are illustrative; actual values depend on batch size, substrate, and machine type.
At a typical textile boiler fuel cost, 58,500 kg of avoided steam per week represents a significant annual saving — without any process modification or capital investment beyond the quality improvement programme that drove the RFT gain. Engineers who want to run this calculation for their own batch frequency and re-dye rate can get a customized RFT energy impact estimate from our team.
Where iFactory AI Fits
iFactory AI is an on-premise AI platform for textile manufacturing that runs entirely within the plant on NVIDIA GPU servers. The RFT energy module connects to quality management systems, batch controllers, and energy meters through 50+ standard connectors, joining the data streams automatically on a shared batch identifier. The resulting KPI — RFT energy premium per kg — updates weekly and feeds both the energy dashboard and the quality performance report.
Frequently Asked Questions
What is a good right-first-time rate target for a dye house?
Industry experience suggests 90–95% RFT is achievable for a dye house processing a moderate shade range with reasonable process control. Best-in-class operations on narrow product ranges reach 97–98%. The energy incentive to push beyond 90% is strong: each percentage point of improvement on a 50-batch-per-day operation eliminates approximately 2–3 re-dye events per week. iFactory AI tracks your RFT rate by substrate and shade depth so improvements are targeted where the energy cost is highest. See what your current RFT rate is costing in energy.
How does the RFT energy KPI support ESG and sustainability reporting?
The RFT energy KPI converts quality improvement directly into Scope 1 and Scope 2 emission reductions — because avoided re-dye batches mean avoided boiler fuel combustion and avoided grid electricity draw. This makes the connection between quality management and carbon intensity measurable for the first time in most mills. For frameworks like GHG Protocol or the Higg Index, having this calculation documented and traceable to source data strengthens the reporting and provides evidence for emission intensity improvement claims. Ask how the RFT energy module integrates with your sustainability reporting workflow.
Can the KPI distinguish between first-pass failures caused by process issues versus raw material variation?
Yes — with the right data inputs. If the batch record includes lot or supplier information for fibre, yarn, or greige fabric, iFactory AI can segment the RFT energy premium by material source as well as by failure mode and machine. This distinction matters for procurement decisions: if a lower-cost supplier is driving a 4% higher re-dye rate, the energy cost of that rework may exceed the material price saving. Walk through how supplier-linked RFT analysis works on your data.
Does improving RFT only save energy, or are there other resource savings?
Every avoided re-dye event also saves water (fresh bath fill), chemicals (stripping and re-dye auxiliaries), machine time (3–8 hours of capacity per event), and wastewater treatment load. In a water-stressed location or a mill with tight effluent discharge limits, the water and wastewater saving from RFT improvement can be as significant as the energy saving. iFactory AI calculates all five resource streams per rework event, not just steam. Ask about full resource cost tracking for rework events.
How is the RFT energy KPI different from tracking kWh per kg production?
The kWh per kg KPI uses total production weight in the denominator, which includes rework batches. This means that as your re-dye rate rises, the denominator stays the same while the numerator grows — but the KPI does not tell you that rework caused the increase. The RFT energy KPI separates productive from rework energy and calculates a premium that isolates the quality-driven cost. When RFT improves, the premium drops — a signal that is completely invisible in a simple kWh/kg trend. See the difference between kWh per kg and the RFT energy KPI on a sample dataset.
Quality and Energy Are the Same Problem. Measure Them Together.
iFactory AI links your right-first-time rate to your steam, electricity, and resource consumption — giving quality and energy teams a shared KPI and a shared improvement target. Book a session to see your own RFT energy data.