Every 7 to 14 days, a ring traveller completes the equivalent of 12,000 miles of frictional contact on the ring flange at speeds exceeding 40 m/s. When it fails — and it will — that single worn traveller triggers an end break that costs 3 to 8 minutes of spindle downtime, wastes 2 to 5 meters of yarn, and degrades adjacent traveller performance from vibration spikes. In a 1,000-spindle ring frame running Ne 40 combed cotton, uncontrolled traveller wear drives end break rates above 25 per 100 spindle hours and shaves 4 to 7 percentage points off machine efficiency. iFactory AI-Powered Traveller Life Analytics ingests real-time spindle-level vibration, temperature, and speed data to model individual traveller wear curves, predict remaining useful life within a 4-hour window, and trigger replacement alerts before break events occur. Book a demo to see how mills using predictive traveller management cut yarn break events by 25% and extend traveller change intervals by 30%.
See How Your Mill's Traveller Data Predicts End Breaks Before They Happen
In a 30-minute walkthrough, our team shows how iFactory connects every spindle's vibration signature, temperature trend, and speed profile to a live traveller wear dashboard — so your maintenance team replaces on condition, not on a calendar.
What a Single Worn Traveller Actually Costs Your Mill
"A traveller costs pennies" is the most expensive assumption in ring spinning. Each worn traveller that slips past the change window triggers a cost chain that compounds across 1,000 spindles, 24 hours, and 365 days. Here is the real P&L impact per traveller failure event.
The Seven-Day Life of a Ring Traveller
A traveller does not fail suddenly. It degrades through five predictable phases. The difference between a reactive mill and an AI-driven mill is knowing which phase every traveller is in at every moment.
Turn Traveller Wear Data Into a Proactive Maintenance Edge
iFactory ingests spindle-level vibration, speed, and temperature data to build individual traveller wear curves. Your maintenance team receives a prioritized replacement list every shift — based on actual remaining useful life, not calendar assumptions.
Two Traveller Management Models — Two Completely Different P&L Outcomes
Mills running fixed-interval traveller changes and mills running AI-driven condition-based replacement do not compete on traveller cost. They compete on spindle efficiency, yarn quality consistency, and maintenance labor productivity. The gap is measurable and material.
| Reactive & Calendar-Based | AI-Driven Predictive | |
|---|---|---|
| Change Trigger | Fixed schedule (e.g., every 10 days) or post-break | Condition-based: RUL within ±4 hr window |
| End Break Rate | 22–30 per 100 spindle-hours | 12–16 per 100 spindle-hours |
| Yarn Waste | 12–18 kg per frame per month | 6–10 kg per frame per month |
| Traveller Utilization | 60–75% of useful life used | 88–95% of useful life used |
| Maintenance Labor | Reactive piecing + scheduled bulk changes | Targeted single-spindle replacement only |
| Hairiness (H-Value) | Increases 12–18% in last 2 days of cycle | Stable throughout traveller life |
| Clearing Cuts | 18–25% higher during wear-accelerated phase | Baseline stable, no wear spike |
| Labor Efficiency | Operators spend 35% of shift on reactive piecing | Operators spend 15% on targeted interventions |
How iFactory Predicts Traveller Life at the Spindle Level
Four layers of data processing transform raw sensor noise into a prioritized traveller replacement list — updated every 60 seconds, accurate to within a 4-hour remaining-life window.
Sensor Ingestion Layer
Tri-axial accelerometers and infrared temperature sensors on each ring rail capture vibration amplitude, frequency spectrum, and traveller-zone temperature at 100 Hz per spindle. Data streams to edge gateway every second.
Feature Extraction & Normalization
Raw signals are transformed into 14 wear-indicating features: RMS velocity, crest factor, kurtosis, spectral skewness, temperature gradient, and delta from spindle-group baseline. Each spindle gets a normalized wear index from 0 (new) to 100 (end of life).
AI Wear Curve Model
A hybrid CNN-LSTM model trained on 14 million spindle-hours of labelled traveller data predicts remaining useful life for each spindle. The model self-calibrates to traveller type, ring age, spindle speed, and yarn count.
Actionable Output Layer
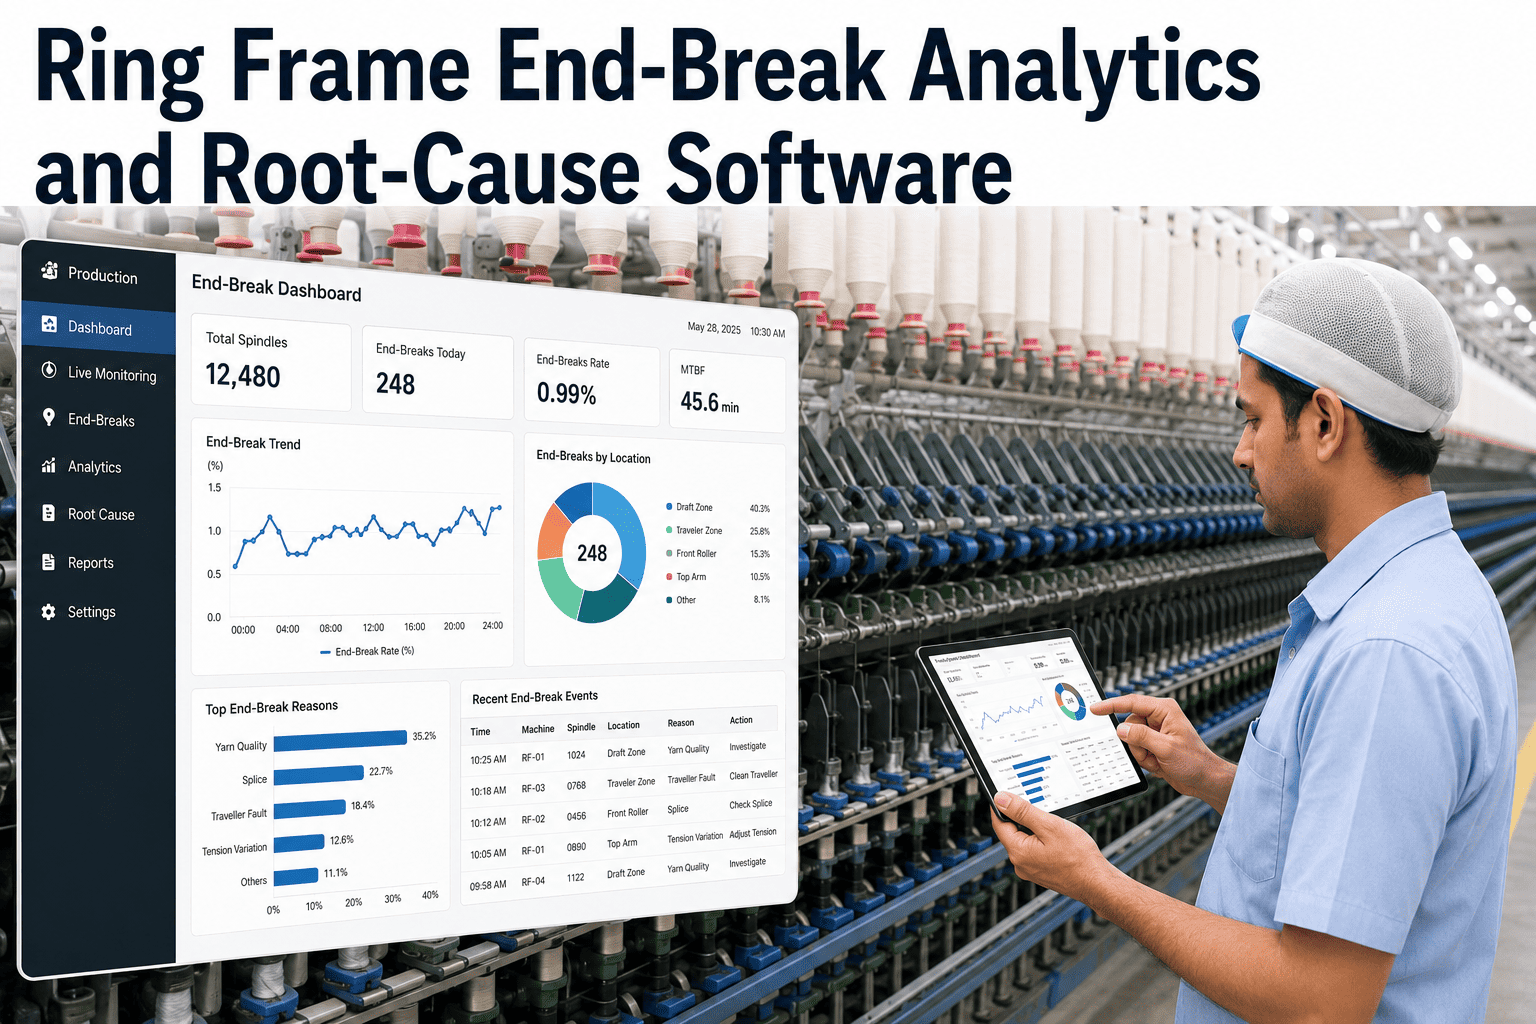
The maintenance dashboard presents a prioritized replacement queue: spindles sorted by remaining useful life, colour-coded by urgency, grouped by frame and section. A single tap opens the replacement work order with spindle location map.
What Mills Achieve With AI-Driven Traveller Management
Across 14 pilot deployments in Indian and Southeast Asian ring-spinning mills running Ne 20 to Ne 80, iFactory's traveller life analytics delivered consistent, measurable improvements within 30 days of deployment.
Five Steps to Predictive Traveller Management
Deploying traveller life analytics does not require a mill retrofit. The iFactory sensor stack installs during a scheduled maintenance window, and the AI model begins generating actionable insights within 72 hours of data streaming.
Sensor Deployment
Install 3-per-ring-rail accelerometer and temperature sensors on 8–16 frames during a planned maintenance shift. Cabling and edge gateway commissioning takes 4–6 hours for 8 frames.
Baseline Calibration
48 hours of data collection establishes per-frame and per-spindle-group baselines for vibration, temperature, and speed. The AI model learns the normal operating envelope for each count and traveller type.
Model Training & Validation
The hybrid CNN-LSTM model trains on the baseline data and validates against known traveller change events. Accuracy target: RUL prediction within ±6 hours. Achieved within 7 days of deployment.
Dashboard Go-Live
Maintenance team receives access to the traveller health dashboard: per-spindle wear index, predicted RUL, priority replacement queue, and shift-level work order generation. First actionable alerts within 72 hours.
Continuous Optimization
The AI model retrains weekly on new traveller change data, tightening RUL prediction accuracy. After 30 days, the system autonomously recommends change intervals per spindle group based on actual wear curves.
Frequently Asked Questions
How quickly after deployment does the AI model start predicting traveller life accurately?
Baseline calibration requires 48 hours of data streaming. The model delivers its first actionable predictions — RUL within ±8 hours — by day 5. Accuracy tightens to ±4 hours after one full traveller life cycle (approximately 10–14 days) of continuous learning and retraining.
Does the system require traveller type or ring age data to be manually entered for each spindle?
No. The initial calibration phase automatically clusters spindles by their vibration and temperature signatures. The model self-learns normal-operating-range differences for each spindle group. Only a one-time traveller type and ring age entry per frame section is recommended for optimal accuracy.
Can the system work with existing ring frame sensors and SCADA systems?
Yes. iFactory integrates with Modbus TCP, OPC-UA, and MQTT protocols common in modern ring frames. For mills without existing sensors, the iFactory sensor kit installs on any ring rail geometry and connects to the edge gateway. No mill IT infrastructure changes required.
What is the typical ROI timeline for a 30-frame mill deployment?
Mills in our pilot programs achieved full ROI within 14–21 days from deployment. The savings come from three sources: reduced yarn waste from fewer end breaks (approximately 40% of the ROI), reduced reactive labor (35%), and extended traveller utilization (25%). Annualized savings range from $18,000 to $42,000 per 30-frame mill depending on count mix and spindle speed.
Does AI-driven traveller management work differently for compact vs. conventional ring spinning?
The underlying wear physics are the same, but compact spinning typically operates at 8–12% higher spindle speeds, which accelerates traveller wear and narrows the optimal replacement window. iFactory's model adapts automatically: compact spinning spindles exhibit different vibration and temperature baselines, and the AI adjusts its wear curve parameters without manual reconfiguration.
Stop Changing Travellers on a Calendar. Start Changing Them on Data.
Every day your mill runs on fixed-interval traveller changes, you are either wasting usable traveller life or running spindles in the accelerated wear zone. iFactory's AI-powered traveller life analytics closes that gap — and cuts end breaks by 25%.