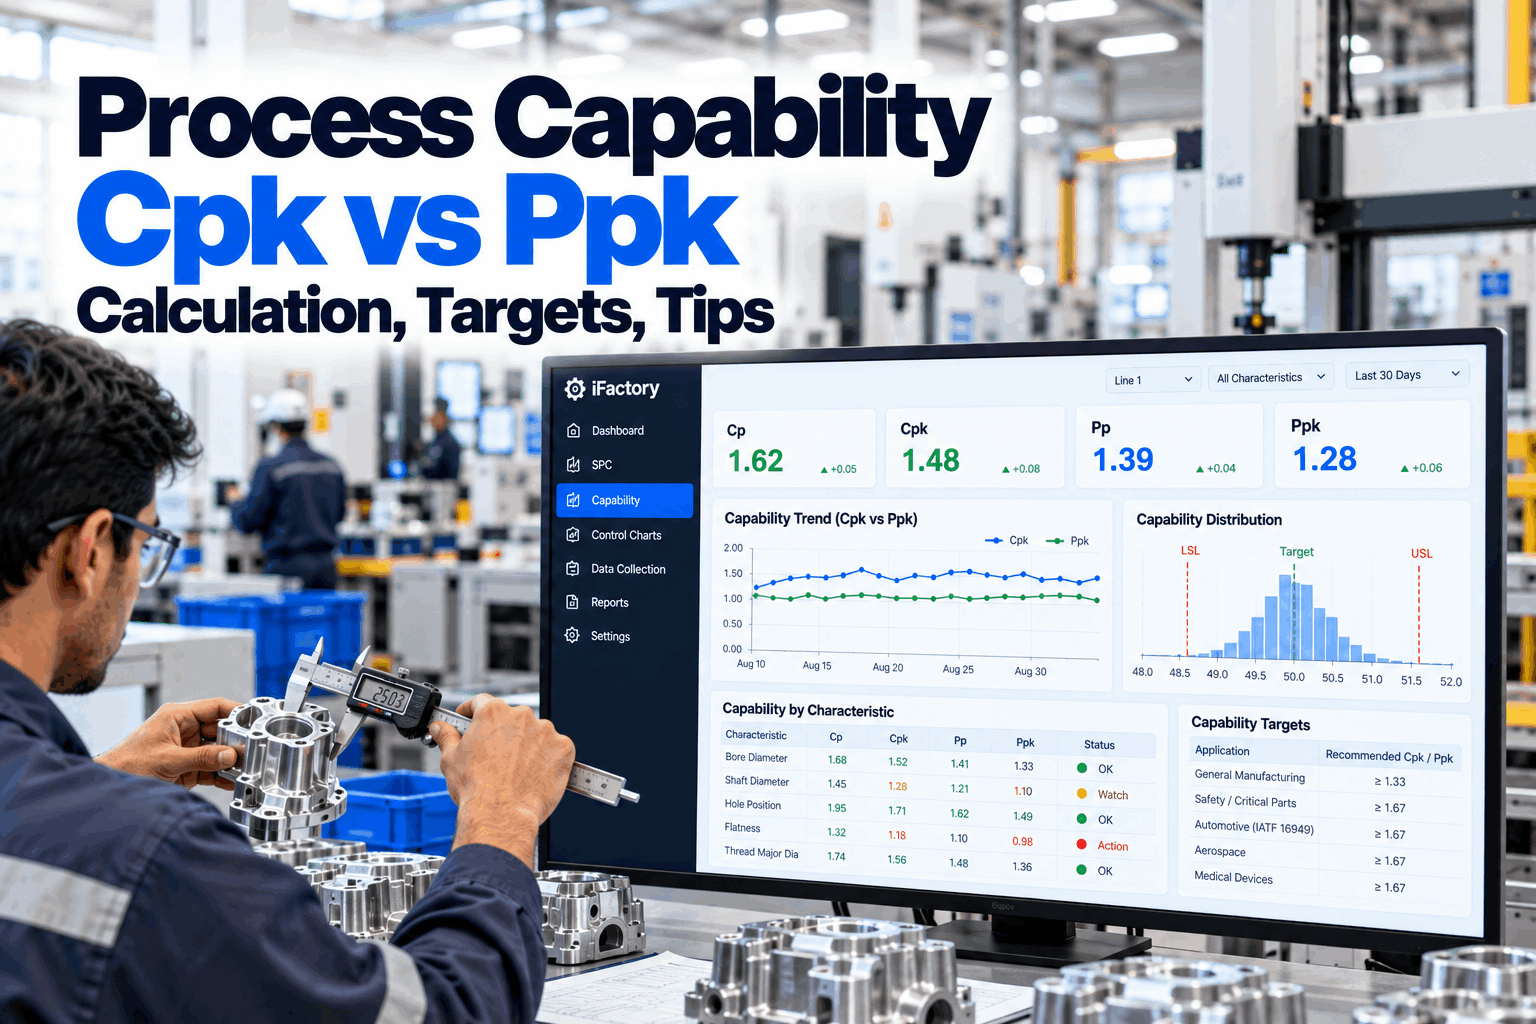
A process capability study has a hidden expiry date. You pull a sample, run the numbers, get a Cpk of 1.45, file the report — and that number was true the day you calculated it and slowly becomes a fiction after. Tooling wears, material lots shift, seasons change the shop floor, and the process that was capable at launch may be quietly incapable months later while the filed study still says otherwise. That's the problem with capability as a one-time exercise: it's a snapshot of a moving thing. The fix is to compute Cp, Cpk, Pp, and Ppk automatically from live data and trend them, so capability is a metric you watch rather than a study you archive — and you see it erode before it becomes scrap. Read together, the four indices tell you not just whether you're capable but what to fix. You can book a demo to see live capability on your data.
Capability Is a Living Metric, Not a Study You File Once
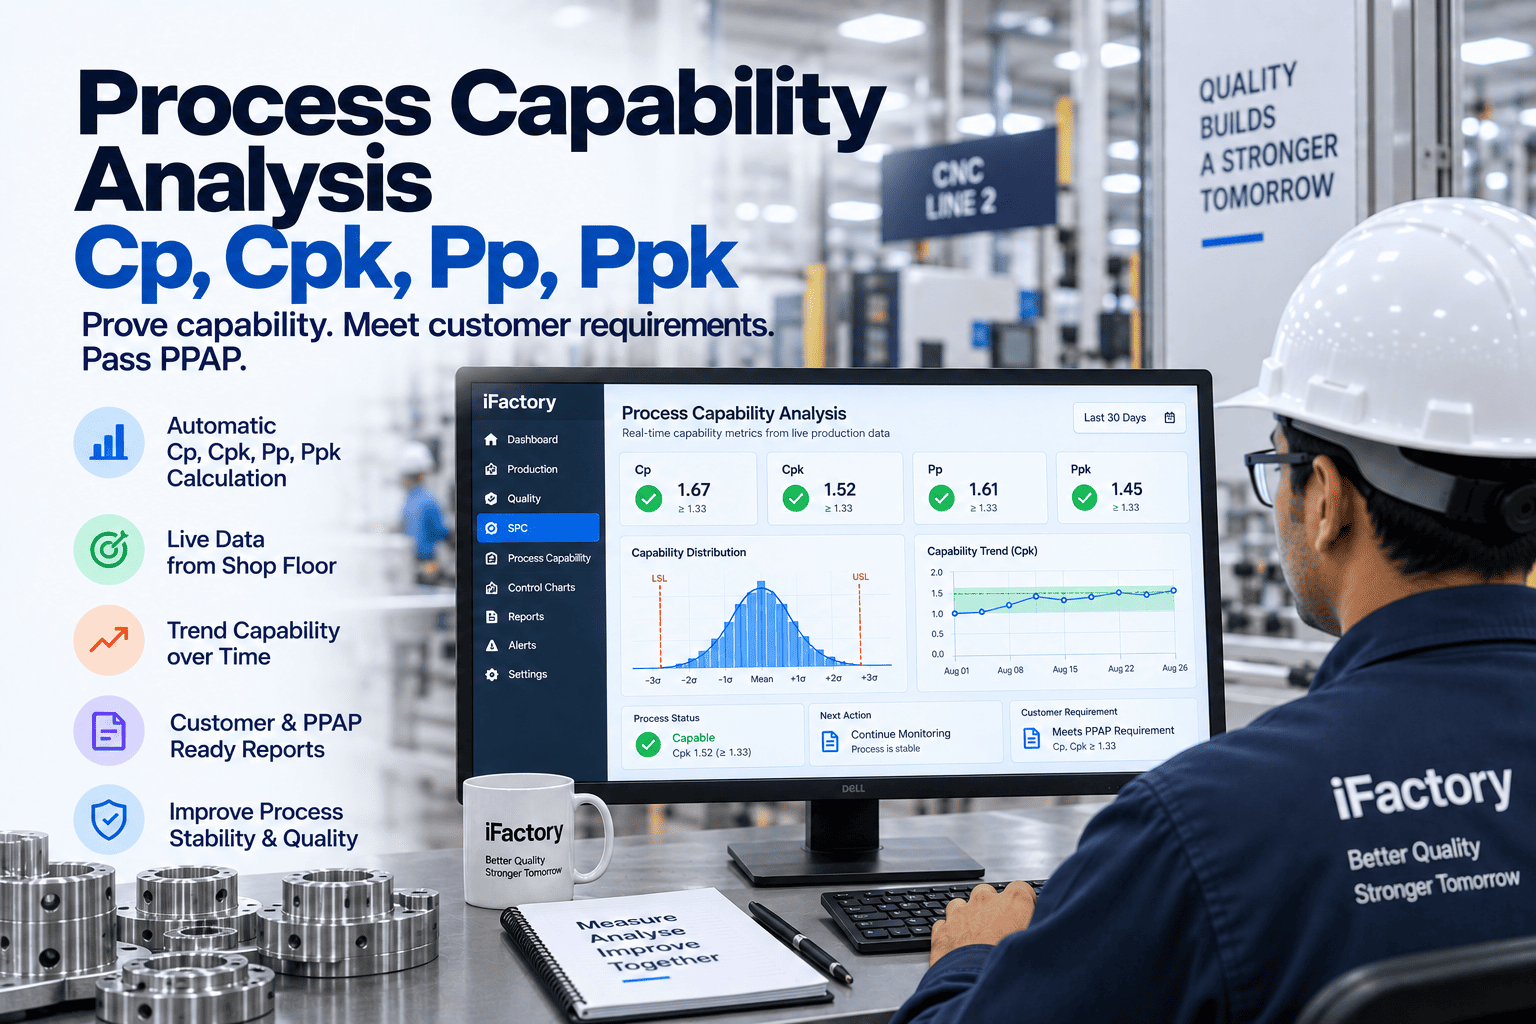
Calculate Cp, Cpk, Pp, and Ppk automatically from live data to prove capability, satisfy customers, and pass PPAP — then trend all four over time, so you catch capability eroding before it becomes scrap.
What Each Index Actually Tells You — and Why You Need All Four
Cp, Cpk, Pp, and Ppk look similar and get used interchangeably, which is where most capability mistakes start. In truth they answer two different questions along two different axes: short-term versus long-term variation, and spread-only versus spread-and-centering. Reading them as a set is what turns four numbers into a diagnosis. Here's what each one is actually measuring.
The ratio of the specification width to the short-term, within-subgroup process spread. It tells you what the process is capable of if it were perfectly centered — potential capability. It says nothing about where the mean actually sits, which is why Cp alone can look great while parts fail.
The same within-subgroup spread as Cp, but penalized for how far the mean has drifted off-center. Cpk is always less than or equal to Cp, and the gap between them is pure centering opportunity — it tells you how much capability you'd gain by just re-centering, before touching variation.
The same idea as Cp but using the overall standard deviation from all the data together, not within-subgroup — so it captures the full long-term variation including drift and shifts. Because overall variation is always at least as large as within-subgroup, Pp is always less than or equal to Cp.
Overall variation and accounting for centering — the index that most closely reflects what the customer experiences over time, including every shift, operator, and material change. Ppk is always less than or equal to Cpk, and the relationship between them is the most useful diagnostic capability offers.
The Space Between the Indices Tells You What to Fix
The single most useful thing about calculating all four indices isn't any one number — it's the gaps between them. Because the mathematical relationships are fixed (Cpk ≤ Cp, Ppk ≤ Cpk, Pp ≤ Cp), the size of each gap points directly at a specific problem and a specific fix. This is the reading that turns capability from a pass/fail stamp into an improvement roadmap.
When Cp is high but Cpk is much lower, your spread is fine — the process just isn't centered in the spec. The fix is re-centering the mean, which is usually faster and cheaper than reducing variation, and the gap tells you exactly how much you'd gain.
When short-term Cpk looks strong but long-term Ppk is much weaker, the process drifts between subgroups — machine drift, operator differences, material lots. The gap quantifies how much of your variation is long-term instability rather than short-term noise.
When the long-term and short-term indices are close, the process is consistent over time — what you see in a subgroup is what you get across the run. That's the signature of a genuinely stable, predictable process you can trust between studies.
When even Cp is low, centering won't save you — the spread is simply too wide for the tolerance. This is the case that demands real variation reduction, and it's distinguishable from a centering problem only because you calculated Cp, not just Cpk.
Read All Four Indices as One Diagnosis
iFactory computes Cp, Cpk, Pp, and Ppk together from live data and surfaces the gaps between them — so you know whether to re-center, reduce variation, or chase instability, not just whether you passed.
A Study Done at Launch May Not Describe the Process Today
The traditional capability study is a point-in-time exercise: gather a sample, calculate the indices, file the report for the PPAP or the customer. It's necessary, but it has a built-in weakness — it describes the process only at the moment it was run. Everything that changes a process afterward is invisible to a study sitting in a folder, which is why capability should be monitored continuously, not certified once.
Tool wear, material-lot changes, seasonal shifts, and operator differences all move capability after the study is filed. A launch Cpk of 1.5 can quietly become 1.1 months later, and a one-time study has no way to show it happening.
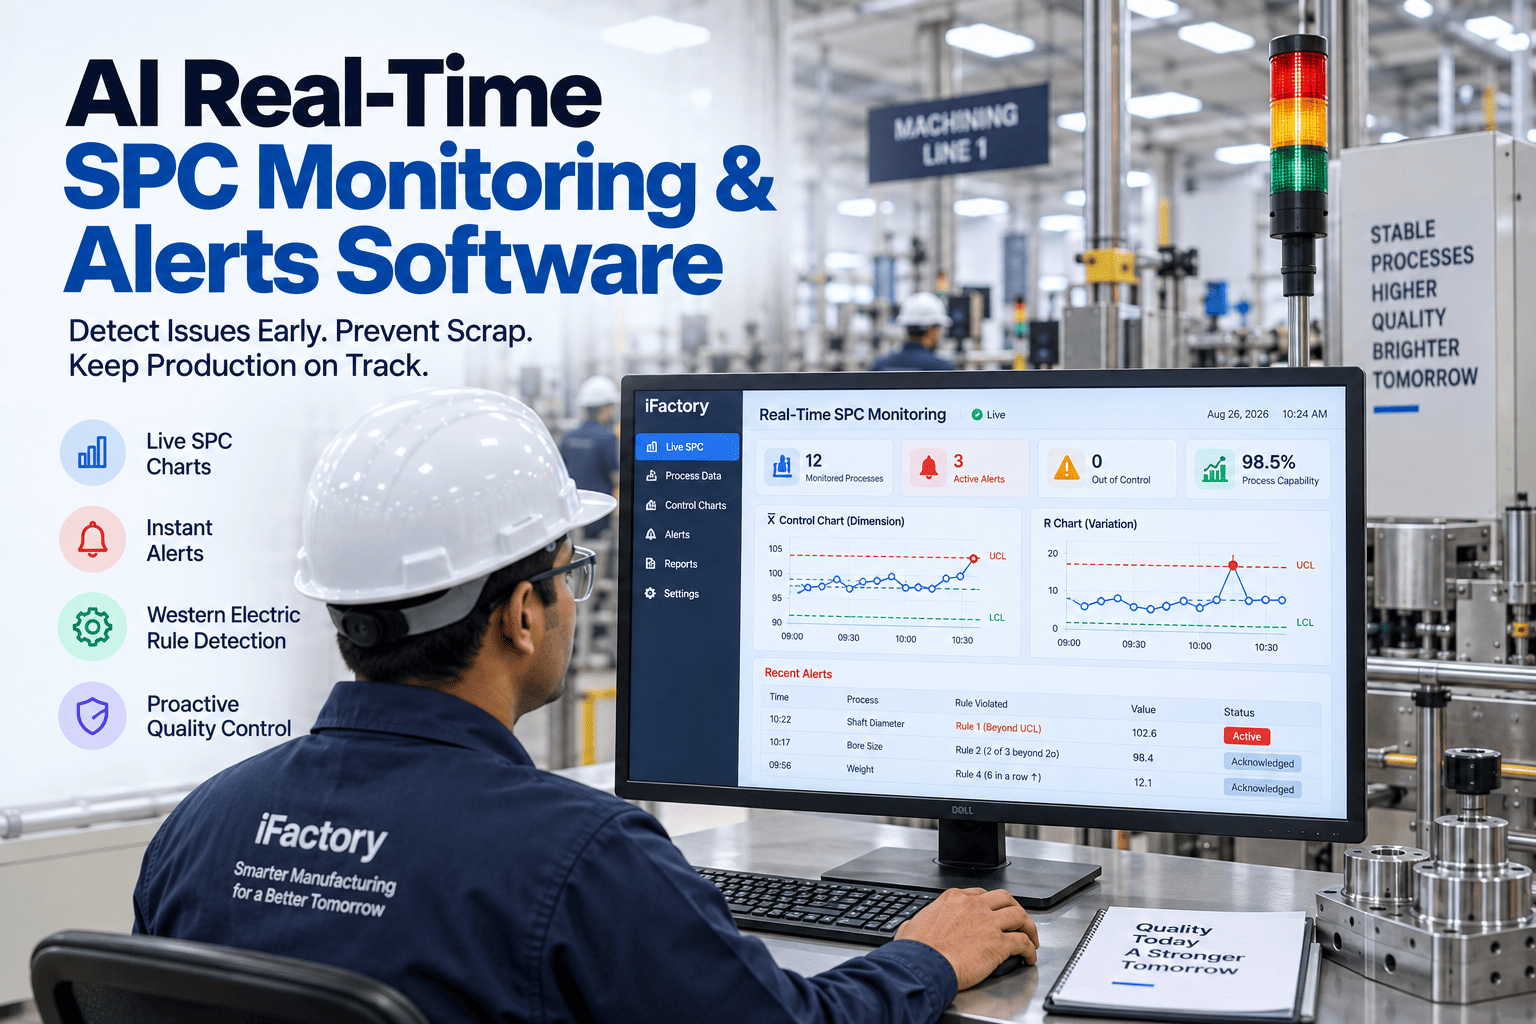
When Cp, Cpk, Pp, and Ppk are calculated continuously from production data, a downward trend surfaces while parts are still good — the capability equivalent of catching drift before it becomes scrap, rather than discovering it in the next audit.
A single number can't distinguish a stable process from one sliding downward that happens to still be above threshold today. Trending the indices over time shows the trajectory, so you act on the slope, not just the current value.
When capability is computed live and retained, producing the study a customer or PPAP submission asks for is a query against current data rather than a fresh data-collection project — the report reflects the process as it is right now, and the history is already there.
Capability Indices Are Only Valid When Their Assumptions Hold
The most costly capability mistakes in manufacturing come from misreading the number, not from the arithmetic. A capability index calculated on data that violates its assumptions is mathematically valid and practically meaningless — and acting on it leads to false confidence or wasted effort. A good capability system guards these assumptions rather than blindly computing a number.
Capability is meaningless on an out-of-control process — if the control chart shows special-cause variation, the Cpk is a number without meaning. Verify statistical control before interpreting any index; capability answers "how good," only after control answers "is it predictable."
Small samples make capability indices swing unpredictably. Credible estimates need a minimum of 25 to 30 subgroups or 100-plus individual measurements — fewer than that and the number is more noise than signal, however precise it looks.
The standard Cp/Cpk formulas assume a normal distribution. For naturally non-normal data — flatness, roundness, many form characteristics — a transformation or a non-normal capability method is required, or the index misleads.
A strong Cpk alongside real defects is a red flag, not a contradiction — it points to a measurement-system error, a special cause, or a process that isn't as stable as it looks. The number is telling you to check the assumptions, not the parts.
The Same Live Data That Runs the Floor Satisfies the Auditor
Capability isn't only an internal improvement tool — it's what customers and PPAP submissions demand as evidence a process can hold tolerance. When the indices are computed live and trended, meeting those external demands stops being a scramble, because the proof is continuously maintained rather than assembled on request.
A PPAP submission requires capability evidence on special characteristics, commonly Ppk at or above 1.67 initially. With live calculation, that report generates from current data rather than a one-off study run specifically for the submission.
When a customer sets a Cpk target on a characteristic, live monitoring shows whether you're holding it every day, not just on the day of the study — so a slip is caught internally before it shows up in a customer scorecard.
Safety and regulatory characteristics carry the tightest capability requirements. Flagging them and monitoring their indices continuously ensures the ones that matter most never drift below their bar unnoticed.
A retained capability history demonstrates not just a passing number but sustained capability over time — increasingly what customers and auditors want to see, and something a single study can never provide.
All Four Indices, Live, Trended, and Guarded
iFactory calculates Cp, Cpk, Pp, and Ppk continuously from the same production data that feeds your control charts, trends them over time, surfaces the diagnostic gaps between them, and guards the assumptions that make them valid — so capability is a living metric you manage, not a study you file and forget.
What Quality Teams Ask About Process Capability Analysis
Stop Filing Capability Studies That Go Stale
iFactory computes Cp, Cpk, Pp, and Ppk live from your production data, trends them so drift shows before scrap, and reads the gaps between them into clear guidance — proving capability to customers and PPAP from data that's always current.