The problem with traditional SPC isn't the statistics — it's the lag. A control chart shows an out-of-control condition only after the measurement data arrives, which means anywhere from a couple of hours for inline metrology to two days for offline checks. So by the time an engineer sees a chart trending toward the limit on a weekly report, the line has already produced a full shift of parts between marginal and scrap. The chart was right; it was just late. Real-time SPC closes that gap: data streams into the chart as it's produced, a rule engine evaluates every sample the instant it lands, and the operator is alerted the moment drift begins — not after the first bad unit ships. That's the difference between acting on a trend and cleaning up the wreckage. You can book a demo to see it on live data.
Catch the Drift on the Sample, Not on Next Week's Report
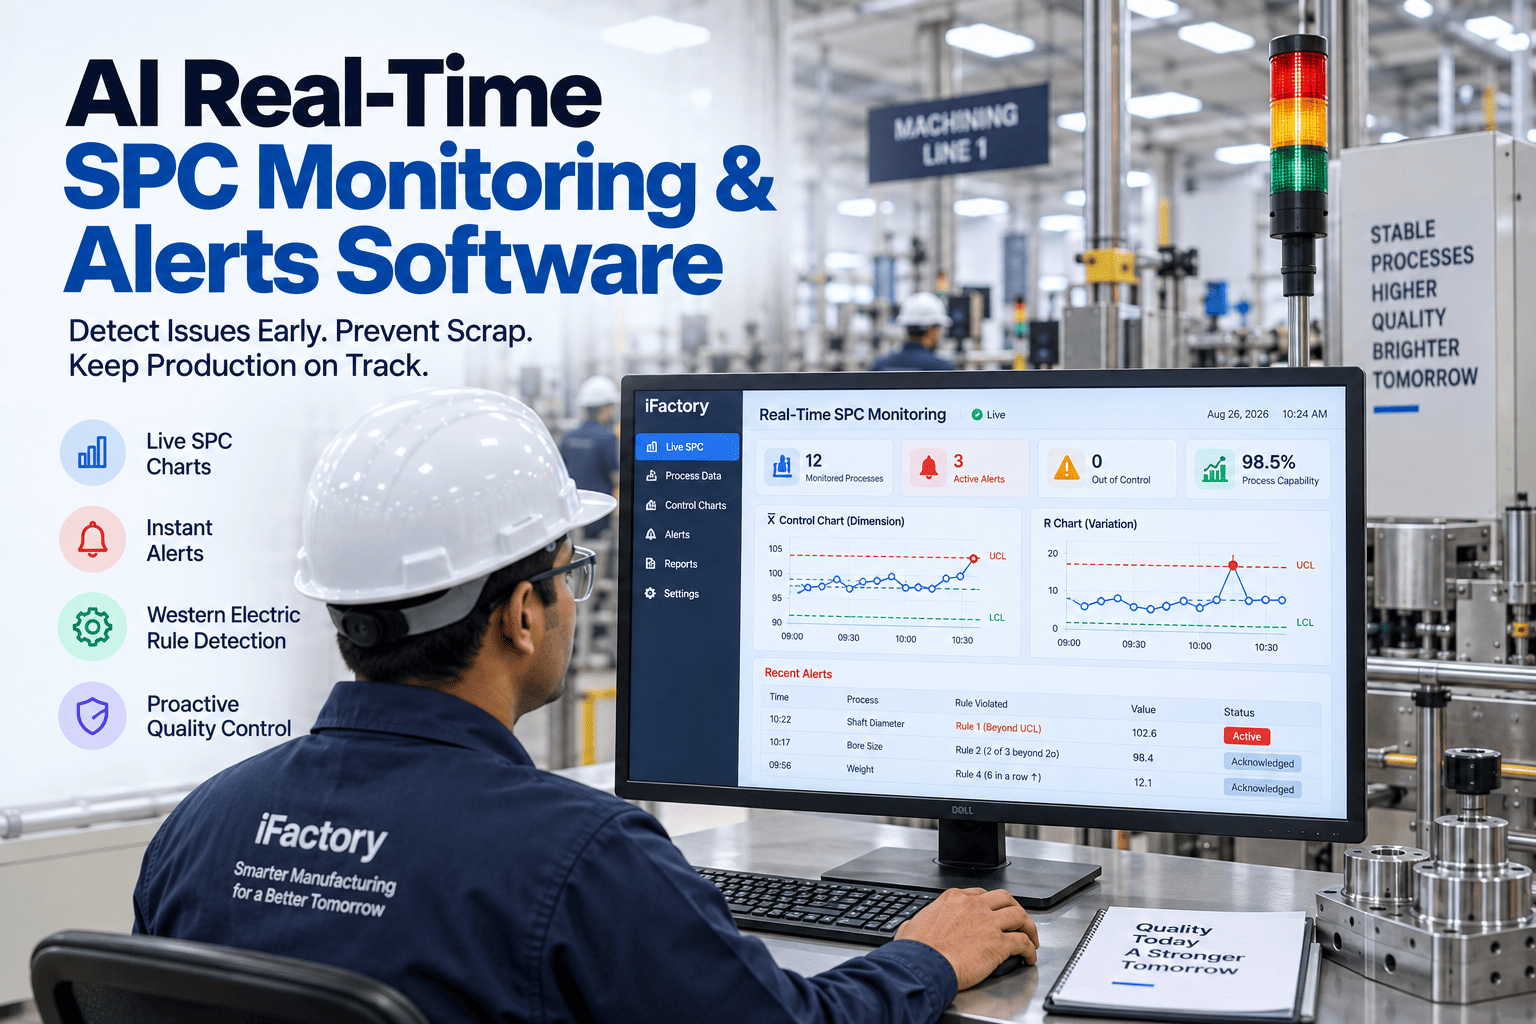
Stream live process data into control charts, evaluate every Western Electric and Nelson rule on every sample as it lands, and alert operators the instant a process starts drifting — so you intervene before drift becomes scrap.
A Chart You Read Weekly Describes Scrap You Already Made
The entire cost of traditional SPC hides in the delay between the process going wrong and someone seeing it. Whether the data is hand-entered at end of shift or pulled from offline metrology the next day, the chart is always describing the past — and a process that drifted at the start of a shift has been making marginal parts the whole time the chart waited to be read. Closing that lag is the whole point, and it's where real-time monitoring separates from the spreadsheet.
By the time a control chart trending out of spec surfaces on a weekly or end-of-shift report, the line has typically already produced a full shift of parts somewhere between marginal and scrap. The review cadence is slower than the failure.
Hand-plotting points and eyeballing them against rules is slow, inconsistent, and impossible at line speed — so in practice most rule violations are simply never caught, because no human is checking every sample against every rule.
A process drifting inside the spec limits is still making good parts — for now — but it's heading somewhere. Without live monitoring, that drift is invisible until it crosses into out-of-spec, which is exactly too late.
The worst version of the lag is the out-of-spec unit that ships before the chart is read. Catching drift in real time is what keeps a process problem from becoming a customer's problem and a containment action.
Every Western Electric and Nelson Rule, Checked as the Point Lands
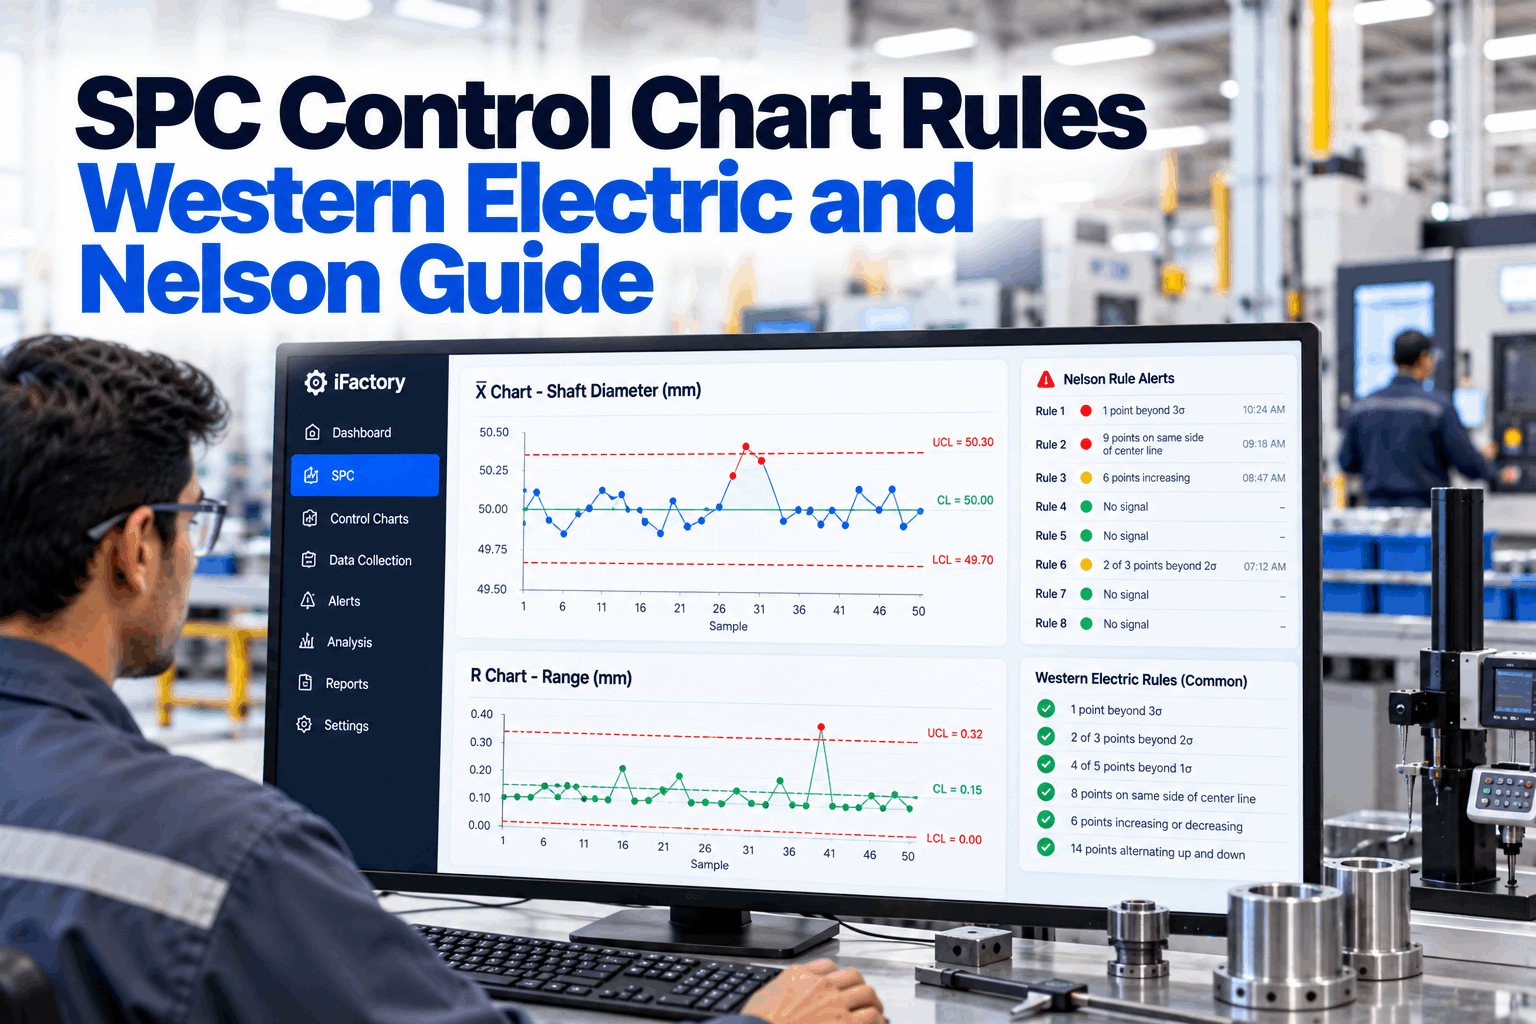
The heart of real-time SPC is a rule engine that evaluates each new data point against the full set of control-chart rules automatically, the instant it's plotted — something no human can do at line speed. These rules catch not just the obvious outlier but the subtle shifts and trends that signal a process losing control before any point crosses a limit. Here's what the engine watches for.
The classic out-of-control signal: a single point outside the upper or lower control limit, set at three standard deviations. There's only about a 0.3 percent chance a normal process produces this, so it's a near-certain special cause demanding immediate attention.
A run of consecutive points on the same side of the centerline — eight or nine depending on the ruleset — signals a sustained shift in the process mean, even though no single point is out of limits. It's the drift the eye misses and the engine catches.
A sequence of points trending consistently up or down flags tool wear, drift, or a gradual process change while it's still developing — the early-warning pattern that lets you intervene before the trend ever reaches a limit.
The zone tests partition the chart into one, two, and three-sigma bands and count how many recent points fall in the outer zones — catching increased variation and instability patterns that a simple limit check would miss entirely.
The four Western Electric rules came out of telephone manufacturing to catch shifts and trends in continuous production streams; Nelson later extended them to eight, adding pattern-detection rules for oscillation and stratification. Nelson is a superset — several Nelson rules are identical to the Western Electric originals. A real-time engine runs whichever set you choose on every sample, so you get the foundational four or the full eight without anyone checking by hand.
Run Every Rule on Every Sample, Automatically
iFactory streams your process data into live control charts and evaluates all eight Western Electric rules plus the Nelson set on every point — so a violation is caught the instant it happens, not on a report.
Turning On Every Rule Everywhere Is How You Miss the Real Signal
It's tempting to enable all eight rules on every chart for maximum coverage, but that's the classic mistake — and it backfires. Over-ruling generates so many false alarms that operators stop reading them, and the real signal gets lost inside the noise. The uncomfortable truth is that fewer rules, applied to the right chart types, catch more genuine events, because the alerts stay credible enough to act on. A real-time engine has to be configurable, not maximal.
Not every rule is valid on every chart — some patterns are meaningless on certain chart classes and produce pure false alarms. Enabling only the rules appropriate to each chart is what separates signal from noise.
A high-variability parameter can carry a lighter ruleset to avoid nuisance alerts, while a critical-to-quality characteristic keeps strict enforcement. Tuning per parameter keeps both usable rather than applying one blanket policy.
Each rule carries a configurable severity and alert route, so a near-certain Rule 1 violation escalates hard while a subtle trend goes to the process engineer — the response matches the signal's real weight.
The measure of a good configuration is that operators trust the alerts. When the noise is tuned out, a real-signal detection rate that started low can climb toward complete, because every alert that fires is worth answering.
A Violation Is Only Useful If It Reaches Someone in Time
Detecting a rule violation instantly matters only if the alert lands in front of the person who can act while the process is still running. The real-time loop isn't complete at detection — it's complete when an operator has intervened and the drift is corrected before the next part is affected. This is the path from a plotted point to a fixed process.
Data flows directly from CNC controls, CMMs, vision systems, inline gauges, and PLCs into the SPC engine, so the chart is live and no measurement waits for manual entry or an offline batch. The stream is the foundation of the whole loop.
Every sample is checked against the configured rules the moment it lands, and a violation is flagged immediately with its rule, severity, and the parameter and station it came from — so the alert carries the context needed to act, not just a red light.
The alert routes to the operator or engineer responsible for that parameter through the channel they'll see in the moment, so the response happens on the shift the drift started — the entire reason for detecting in real time.
With the signal in hand while the process runs, the operator adjusts before the drift becomes an out-of-spec unit — turning SPC from a record of what went wrong into a control that stops it going wrong.
The Same Live Data Tracks Capability, Not Just Control
Real-time monitoring produces a continuous, trustworthy stream of in-control data, and that stream is worth more than the alerts alone. Because every sample is captured cleanly, the system can track process capability continuously and surface the longer patterns that a violation-by-violation view doesn't show — turning live monitoring into ongoing process intelligence.
Capability indices are calculated live from the same stream rather than in a periodic study, so you always know how much margin each parameter has against its tolerance — and see capability erode before it becomes a rule violation.
Because data is captured consistently, a slow drift that spans shifts — one no single alert would flag — becomes visible as a trend, pointing at tool wear or a creeping setup issue before it produces a violation.
One consistent measurement stream lets you compare the same characteristic across machines and lines, so a station running closer to its limits than its peers stands out as the one to investigate first.
The live stream is also the documented history — every point, rule evaluation, and alert time-stamped — so the monitoring that catches drift also produces the evidence trail for quality reviews and audits.
Live Charts, Configurable Rules, Alerts That Reach the Floor
iFactory streams process data straight from your existing measurement equipment into live control charts, runs the configurable Western Electric and Nelson rule engine on every sample, tracks capability continuously, and routes prioritized alerts to the right person — so drift is caught and corrected in the moment rather than found in a report.
What Quality Teams Ask About Real-Time SPC Monitoring
Turn SPC From a Weekly Report Into a Live Control
iFactory streams your process data into live control charts, runs the configurable Western Electric and Nelson rule engine on every sample, and alerts operators the instant drift begins — so you catch it before it becomes scrap and track capability continuously along the way.