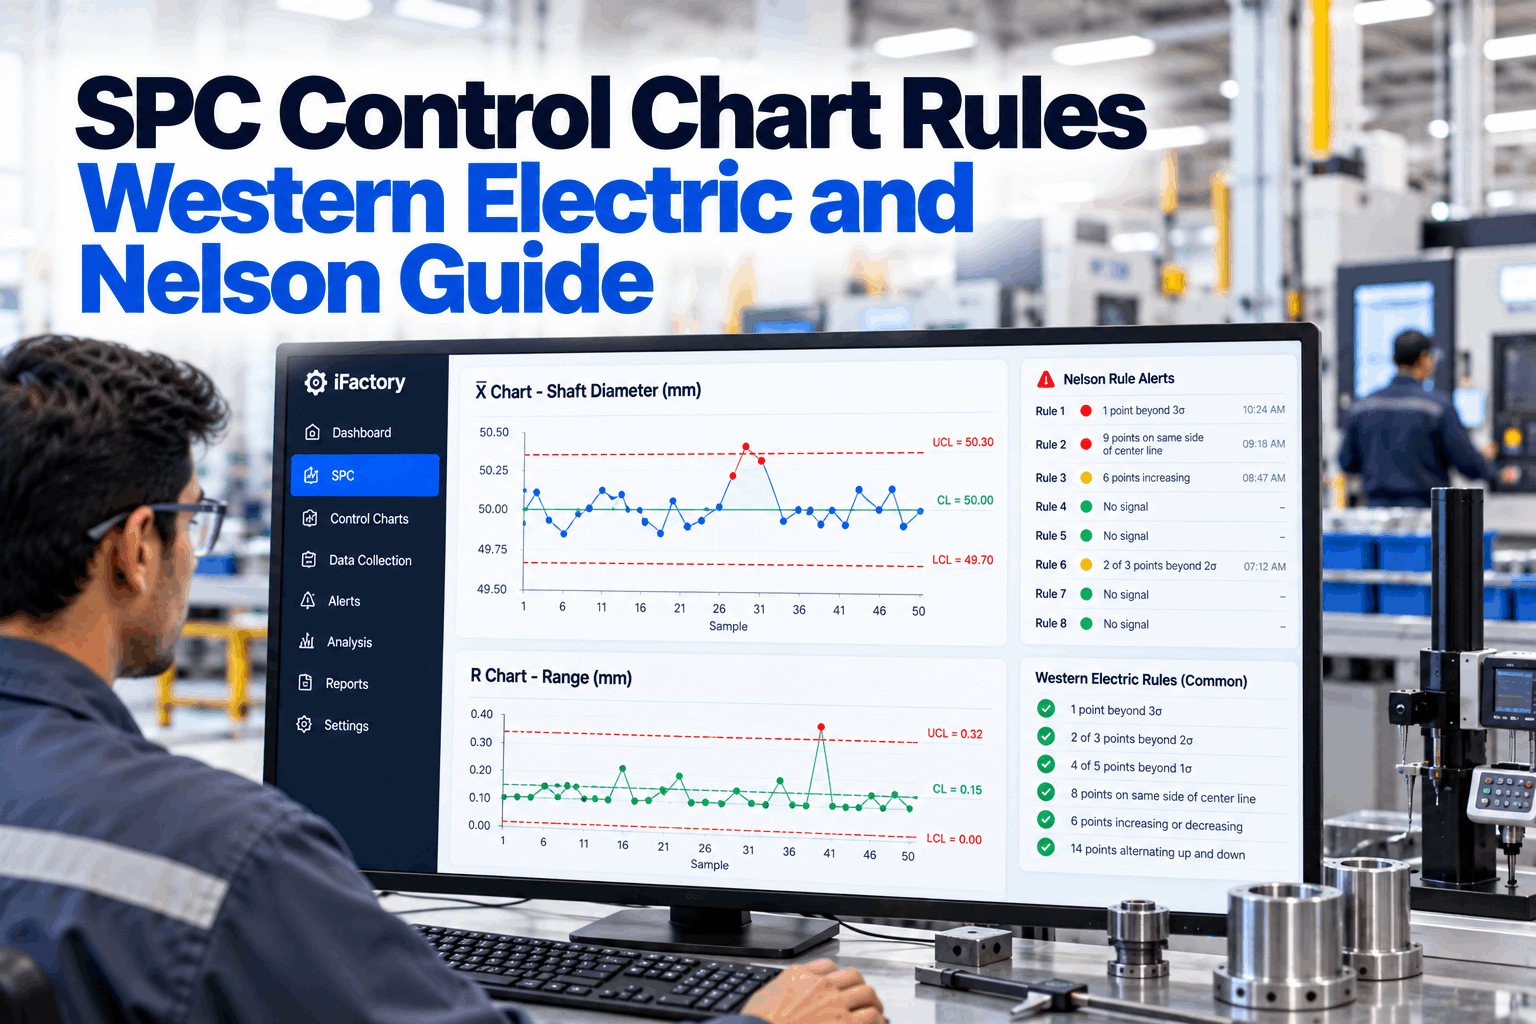
A control chart is only as useful as the rules used to read it. Watch for points outside the control limits alone, and a slow drift can carry a process most of the way to its specification limit before anyone reacts. Apply every rule, and operators drown in false alarms. The Western Electric and Nelson rules give a structured middle ground: patterns that are unlikely when a process is steady and that usually mean something has changed. This guide explains each rule and what to do when one fires. Start with an SPC review.
SPC Control Chart Rules: Western Electric and Nelson Guide
What each rule looks for, why it matters, which ones to switch on and what operators should do when one fires. With live charts that apply the rules for you and attach a reaction plan to every signal.
- All Western Electric and Nelson rules, explained
- Control limits versus specification limits
- Reaction plans for each signal
Control Limits Are Not Specification Limits
One describes the process. The other describes the customer's need.
Specification limits come from the drawing or customer requirement and say what a good part is. Control limits come from the process itself, usually set at three standard deviations either side of the average, and say what the process normally does. A process can be in control and still make bad parts if it is not capable. It can also be out of control while every part is still in spec, which is exactly the moment the rules are designed to catch. Our SPC specialists can review how your limits are set.
Specification limits
- Set by design or the customer
- Decide whether a part is good
- Do not change with the process
- Used for capability, such as Cpk
Control limits
- Calculated from process data
- Show the normal spread of the process
- Recalculated only after a real change
- Used with the rules to spot special causes
An X-bar chart plots subgroup averages, which vary much less than single parts. Putting specification limits on it gives a false sense of safety, because averages can sit comfortably inside spec while individual parts do not.
The Zones Behind the Rules
Most rules use three zones on each side of the centre line.
The area between the centre line and each control limit is split into three equal zones, each one standard deviation wide. Zone C is closest to the centre, zone B is the middle band and zone A is closest to the control limit. In a steady process, most points fall in zone C and very few in zone A. The rules look for patterns across these zones that would be unlikely if nothing had changed. Learn the zones in an SPC training session.
Within 1σ
Where most points of a steady process fall.
1σ to 2σ
Normal, but runs here start to matter.
2σ to 3σ
Rare for a steady process. Clusters here are signals.
The Western Electric Rules
Four zone rules from the Western Electric Statistical Quality Control Handbook.
The Western Electric rules were published in the company's Statistical Quality Control Handbook in the 1950s and remain the most widely taught set. Each rule describes a pattern on one side of the centre line. Rules 2 and 3 count points in zones A and B on the same side, and rule 4 looks for a long run on one side, which catches small shifts that rule 1 would miss. Review how they apply to your charts with our quality team.
The Nelson Rules
Eight rules that add trends, stratification and mixtures.
Lloyd Nelson published his set of eight rules in the Journal of Quality Technology in 1984. They include the Western Electric ideas, slightly adjusted, and add rules for trends, zig-zag patterns and points hugging the centre line. Plan which rules to use with our SPC team.
Fifteen points hugging the centre line can mean the process genuinely improved, and limits should be recalculated. It can also mean subgroups mix parts from several sources, which hides variation. Check how subgroups are formed before celebrating.
Let the Chart Watch the Rules for You
Live charts from gauges and PLC data, with Nelson and Western Electric rules applied on every point and a reaction plan attached to each signal.
Choosing Which Rules to Switch On
More rules catch more changes, and raise more false alarms.
Each rule has a small chance of firing even when nothing has changed. For a steady, normally distributed process, a single point falls beyond 3σ about 0.27% of the time. Adding more rules increases sensitivity to small shifts and also the total false alarm rate. Many plants start with rule 1 plus a few rules that match the failure modes they actually see, then add more where they help. Agree your rule set in a rule setup workshop.
Core set
Rule 1, a run rule and a trend rule for most characteristics.
Extended set
More zone rules for safety and key characteristics.
Tune by evidence
Retire rules that only produce false alarms on a feature.
A Worked X-bar and R Example
Control limits come from the data, using standard constants.
Take a shaft diameter measured in subgroups of five. Over 25 subgroups, the grand average is 25.010 mm and the average range is 0.020 mm. For subgroups of five, the standard constants are A2 = 0.577, D3 = 0 and D4 = 2.114. All figures are illustrative. Work through your own data in a working session.
When each part is measured once and there is no natural subgroup, such as a batch result, use an individuals and moving range chart. Its limits are the average plus or minus 2.66 times the average moving range. The same rules apply, read with care because individual points vary more.
Reaction Plans for Every Signal
A signal without a response is just a coloured dot.
Each rule signal should lead to a clear first step for the operator, often written as an out-of-control action plan. The plan lists what to check, in what order, and when to stop the process or call for help. Attaching the plan to the signal means the right steps appear the moment a rule fires. Different rules can have different plans: a single point beyond 3σ may call for an immediate check of the last parts, while a slow trend may call for a planned adjustment. Write your reaction plans with our quality team.
Learning From Signal History
Every signal and its cause is a lesson for the next one.
When causes and actions are recorded against each signal, patterns appear. A trend rule that always points to tool wear on one operation suggests a shorter tool change interval. A shift rule that follows each new material lot points to supplier variation. Reviewing signal history monthly turns SPC from firefighting into process improvement. Set up signal reviews with our improvement team.
Most frequent rules
Which patterns appear most on each feature.
Top causes
Tool wear, material, setup or measurement.
Reaction time
From signal to first action.
False alarms
Signals with no cause found, by rule.
Control Chart Rule Mistakes to Avoid
Rules only help when the chart behind them is sound.
These are common problems when plants apply control chart rules. A short SPC review can find them.
What works
- Limits calculated from steady process data
- Rules chosen for each characteristic's risks
- Reaction plans attached to every signal
- Limits recalculated only after real change
What fails
- Using spec limits as control limits
- All rules on every chart
- Recalculating limits after every signal
- Signals acknowledged but never investigated
How iFactory Runs SPC Control Chart Rules
SPC Engine, on your own network.
iFactory's SPC Engine builds live charts from gauges and PLC data, applies Nelson and Western Electric rules on every point, sends alerts by voice and text and attaches the reaction plan to each signal. It runs on an on-prem AI server inside your plant. Fit questions go to our solutions team.
Live charts
X-bar R, individuals and more.
Gauge and PLC data
No manual entry or exports.
Rule sets
Western Electric and Nelson, per feature.
Voice and text alerts
Signals sent to the right people.
Reaction plans
First steps shown with each signal.
Signal history
Causes and actions recorded.
Results depend on your process, measurement system and rule choices. We measure signals, causes found and reaction times on your own data during the pilot.
Turnkey AI: Delivered, Connected and Live in 6–12 Weeks
You do not build this. It arrives ready.
iFactory ships as a pre-configured NVIDIA AI server with the software pre-loaded, racked and ready. Rack it, plug in power and Ethernet, and the AI is live on your network. Our team handles cabling, network setup, PLC, SCADA, DCS and CMMS integration, gauge and PLC links, operator training and 24×7 remote monitoring. Data stays on your network. For a scope matched to your plant, request a turnkey quote.
Ship, network and data
Server installed. Gauges and PLC data connected. Characteristics and limits loaded.
Model training and pilot
Rule sets and reaction plans configured with quality for one cell.
Go-live and training
SPC alerts live across the plant. Operators trained. 24×7 monitoring begins.
Frequently Asked Questions
What are the Western Electric rules?
Four zone-based rules from the Western Electric Statistical Quality Control Handbook that flag points beyond 3σ and runs of points beyond 2σ, beyond 1σ or on one side of the centre line.
What are the Nelson rules?
Eight rules published by Lloyd Nelson in 1984 that cover shifts, trends, zig-zag patterns, points hugging the centre and mixtures.
What is the difference between them?
Nelson's set includes similar zone rules with slightly different run lengths and adds rules for trends, zig-zags, stratification and mixtures.
Should we use all eight Nelson rules?
Not always. More rules mean more false alarms. Start with a core set and add rules that match the failure modes you see.
Are control limits the same as spec limits?
No. Control limits come from process data and show normal variation. Spec limits come from the design and decide whether a part is good.
What should an operator do when a rule fires?
Follow the reaction plan for that characteristic, record what was found and done, and escalate if the plan says so.
Do the rules work on individuals charts?
Yes, the same rules can be applied, but individual values vary more than averages, so some plants use a smaller rule set on individuals charts to limit false alarms.
When should control limits be recalculated?
After a confirmed, lasting change to the process, not after every signal.
How do we start?
Start with one cell and its key characteristics. A 6-week pilot connects gauges, sets rules and attaches reaction plans. To plan it, contact our team.
Catch the Trend Before the Bad Part
In thirty minutes we review your control charts, rules and reaction plans, and show how live rule alerts would work on one cell. You keep the notes either way.
- 1A few current control charts
- 2Your control plan
- 3Rules you use today
- 4Reaction plans if written
- 5One drift that was caught too late