Ask two quality engineers whether a process is capable and you may get two different answers from the same data. One quotes a Cpk of 1.33 and calls it good. The other quotes a Ppk of 1.07 and calls it a problem. Both can be right, because Cpk and Ppk answer different questions. Cpk shows what the process can do in the short term when it is in control. Ppk shows what it actually delivered over the whole period. This guide covers formulas, sample sizes, targets and live tracking. Start with a capability review.
Process Capability Cpk vs Ppk: Calculation, Targets, Tips
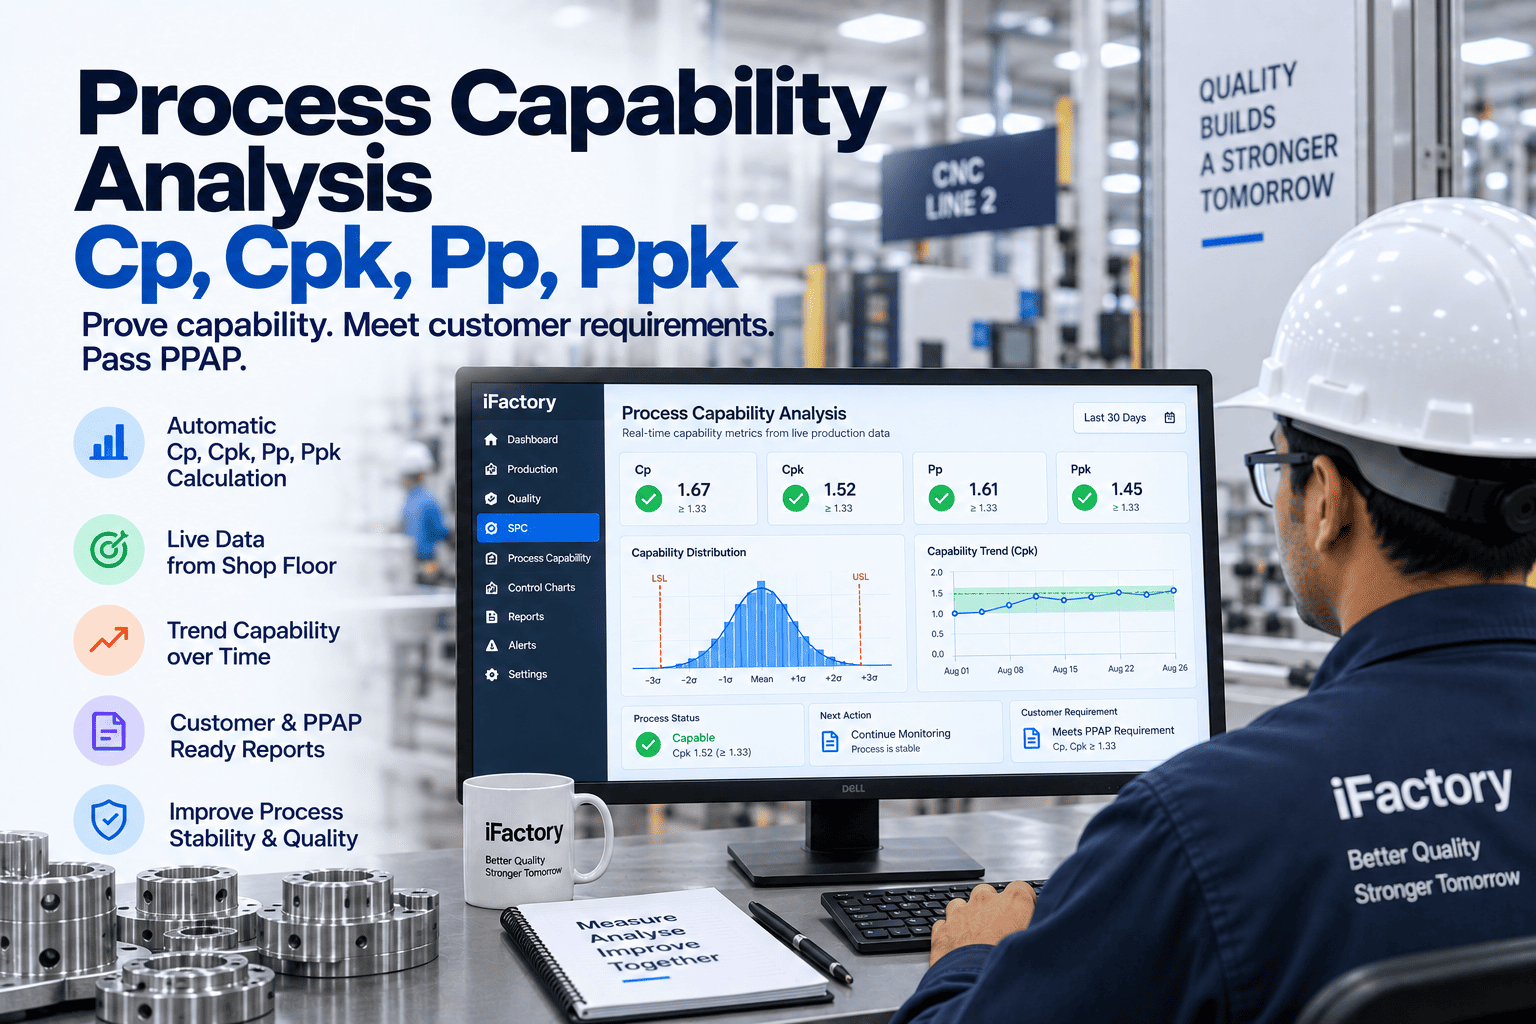
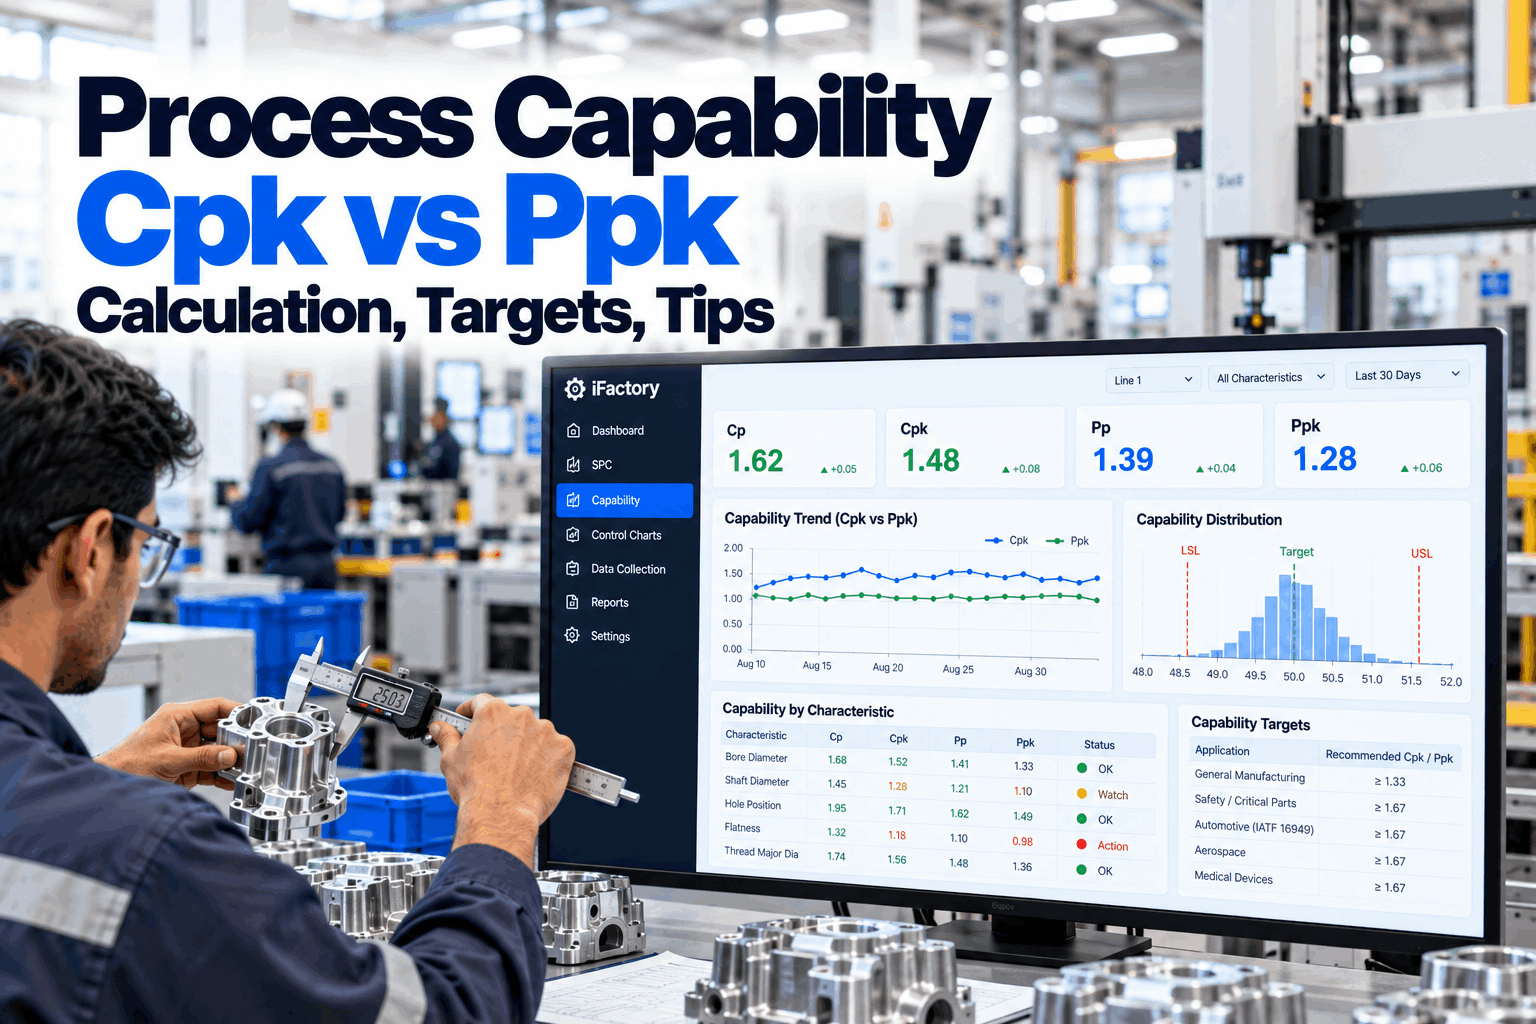
Short-term and long-term capability side by side, for every characteristic, refreshed each shift. Know which features are truly capable and which are drifting toward 1.33 before a customer asks.
- Cp, Cpk, Pp and Ppk, with formulas
- A worked example where Cpk and Ppk disagree
- Targets, sample sizes and common mistakes
Cpk and Ppk Answer Different Questions
Same data, same formula shape, different spread.
Both indices compare the distance from the process average to the nearest specification limit with three times the spread of the process. The difference is which spread they use. Cpk uses the within-subgroup spread, estimated from ranges or moving ranges, which reflects what the process can do over a short period. Ppk uses the overall standard deviation of all readings, which includes shifts and drifts between subgroups. When the process is truly in control, the two are close. When they differ a lot, something is moving the process over time. Reporting only one of them hides half the story, which is why many quality teams now show both on every capability report. Our SPC specialists can review your capability reports.
Cp and Cpk: potential
- Spread from within subgroups
- Short-term, process in control
- What the process can do
- Assumes a steady process
Pp and Ppk: performance
- Spread from all readings together
- Long-term, includes shifts and drift
- What the process actually delivered
- Used for initial studies and PPAP
The Four Formulas
Cp and Pp ignore centring. Cpk and Ppk do not.
Cp and Pp compare the width of the tolerance with the width of the process, as if the process were perfectly centred. For a one-sided specification, such as a minimum strength or a maximum burr height, only the relevant half of the Cpk or Ppk formula applies. Cpk and Ppk use the distance to the nearest limit, so an off-centre process scores lower. The within-subgroup spread is usually estimated as the average range divided by the constant d2, which is 2.326 for subgroups of five, or the average moving range divided by 1.128 for individual readings. Work through your formulas in a training session.
If Cp is high but Cpk is much lower, the process is narrow enough but sitting off centre. Moving the average back toward the middle of the tolerance, often with a simple offset, can raise Cpk without reducing variation at all.
A Worked Example Where Cpk and Ppk Disagree
Cpk says capable. Ppk says the process is moving.
Take a diameter with a specification of 10.00 ± 0.10 mm, measured in 25 subgroups of five parts. The overall average is 10.02 mm. The average range is 0.0465 mm, so the within-subgroup standard deviation is 0.0465 ÷ 2.326 = 0.020 mm. The overall standard deviation of all 125 readings is 0.025 mm. All figures are illustrative. Run the numbers on your data in a working session.
Cpk of 1.33 shows the process can hold tolerance in the short term. Ppk of 1.07 shows it did not over the whole run, because the average moved between subgroups. The fix is not to tighten the machine, but to find what shifts the process over time, such as tool wear, temperature or material lots.
Capability Targets and What They Mean
Higher indices mean fewer parts near or beyond the limits.
Many automotive customers, following AIAG PPAP guidance, look for a Ppk of at least 1.67 in initial process studies and a Cpk of at least 1.33 for ongoing production, with tighter targets for safety-critical characteristics. For a centred, normally distributed process, each level corresponds to an expected rate of parts outside specification. The step from 1.33 to 1.67 looks small on paper but cuts the expected out-of-spec rate by about a hundred times. Agree targets with your customers through our quality team.
Out-of-spec rates assume a centred, normally distributed process. Real processes that are off centre or not normal will differ.
See Capability for Every Characteristic, Every Shift
Cp, Cpk, Pp and Ppk refreshed from gauge and machine data, with AI flagging features drifting toward 1.33 before they become a customer issue.
Sample Size and Data Requirements
A capability index from 20 parts is a guess with decimals.
Capability indices are estimates, and small samples make them uncertain. A common starting point is at least 25 subgroups of four or five parts, or 100 or more individual readings, collected over enough time to include normal sources of variation. With fewer readings, the true value could sit well above or below the number you calculate, so treat small-sample results as rough guides only. The data should come from a measurement system that has been checked, and the process should be in statistical control before Cpk is trusted. Plan your study with our SPC team.
Enough data
25 subgroups or 100 or more readings as a start.
Real variation
Across shifts, operators, lots and tool life.
Trusted measurement
Gauge study done before the capability study.
In control first
Check the control chart before quoting Cpk.
Standard capability formulas assume roughly normal data. Characteristics like flatness, runout or concentricity are often skewed because they cannot go below zero. Use a method suited to the distribution rather than forcing normal formulas onto skewed data.
Improving a Low Cpk or Ppk
There are only three levers: centre the process, reduce spread or stop it moving.
Comparing the four indices tells you which lever to pull. A big gap between Cp and Cpk points to centring. A low Cp points to too much short-term variation. A big gap between Cpk and Ppk points to drift or shifts over time. Plan improvement work with our improvement team.
Centre it
Adjust offsets or targets so the average sits mid-tolerance.
Reduce spread
Fixturing, tooling, machine condition or method changes.
Stop the drift
Tool wear, warm-up, material lots or setup differences.
Capability in PPAP and Customer Reports
Customers want to see the method as well as the number.
Capability results in a PPAP submission or customer report are judged on more than the index. Reviewers look for the sample size, the time period, the control chart, the distribution check and the measurement system study behind each value. Building these into every report from the start saves rework when a customer asks questions. Ask our quality team how reports are assembled.
A complete capability report shows
- Characteristic, specification and units
- Sample size and collection period
- Control chart and distribution check
- Cp, Cpk, Pp and Ppk with the method used
Questions it should answer
- Was the process in control?
- Was the gauge fit for purpose?
- Were the data roughly normal?
- Does the period include real variation?
Tracking Capability Live by Characteristic
A study done once a year shows how things were, not how they are.
Capability changes as tools wear, machines age and suppliers change materials. Calculating Cpk and Ppk on a rolling basis for every characteristic, refreshed each shift, shows which features are getting worse long before they fail. A plant-wide view ranks characteristics by capability, so engineers can focus on the handful that matter instead of reviewing hundreds of reports. The AI watches the trend and flags features moving toward the target line. Ask our implementation team how data is collected.
Capability Mistakes to Avoid
A good number from bad data is worse than no number.
These are the most common errors in capability work. A short capability review can find them.
What works
- Reporting Cpk and Ppk together
- Checking control and measurement first
- Enough data over real conditions
- Rolling capability by characteristic
What fails
- Quoting Cpk from 20 parts
- Calculating Cpk on an out-of-control process
- Normal formulas on skewed data
- Reporting Cp without centring
How iFactory Tracks Process Capability
Capability Dashboard, on your own network.
iFactory's Capability Dashboard calculates Cp, Cpk, Pp and Ppk for every characteristic from gauge and machine data, refreshed each shift, and AI flags features drifting toward 1.33. It runs on an on-prem AI server inside your plant. Fit questions go to our solutions team.
All four indices
Cp, Cpk, Pp and Ppk side by side.
Each shift
Rolling capability, never stale.
Drift flags
Features trending toward your targets.
Live data
From gauges, CMMs and PLCs.
Data checks
Control status and distribution shape.
Capability reports
For PPAP and customer requests.
Capability targets and acceptance remain decisions for your quality team and customers. Figures on this page are worked examples.
Turnkey AI: Delivered, Connected and Live in 6–12 Weeks
You do not build this. It arrives ready.
iFactory ships as a pre-configured NVIDIA AI server with the software pre-loaded, racked and ready. Rack it, plug in power and Ethernet, and the AI is live on your network. Our team handles cabling, network setup, PLC, SCADA, DCS and CMMS integration, gauge and machine links, operator training and 24×7 remote monitoring. Data stays on your network. For a scope matched to your plant, request a turnkey quote.
Ship, network and data
Server installed. Gauges, CMMs and machine data connected. Characteristics loaded.
Model training and pilot
Capability calculations, targets and drift flags configured for one part family.
Go-live and training
Capability dashboard live. Quality team trained. 24×7 monitoring begins.
Frequently Asked Questions
What is the difference between Cpk and Ppk?
Cpk uses the within-subgroup spread and shows short-term potential capability. Ppk uses the overall spread of all data and shows long-term actual performance.
Why is Ppk usually lower than Cpk?
Because the overall spread includes shifts and drift between subgroups. A large gap means the process is moving over time.
What Cpk target should we use?
Many customers ask for at least 1.33 in ongoing production and 1.67 Ppk in initial studies, with higher targets for critical characteristics. Your customer requirements decide.
How many parts do we need?
A common starting point is 25 subgroups of four or five, or at least 100 readings, taken over real production conditions.
What does a Cpk of 1.33 mean?
The nearest specification limit is four standard deviations from the average. For a centred, normal process, that means about 63 parts per million outside specification.
Can Cpk be calculated on any data?
It should be calculated on in-control data from a sound measurement system. Skewed characteristics need methods suited to their distribution.
How do we raise a low Cpk?
Compare Cp, Cpk and Ppk. If Cp is much higher than Cpk, centre the process. If Cp is low, reduce variation. If Ppk is much lower than Cpk, find what moves the process over time.
How often should capability be checked?
Continuously where data is available. A rolling calculation each shift shows decline long before an annual study would.
How do we start?
Start with one part family and its key characteristics. A 6-week pilot connects data and sets up the dashboard and flags. To plan it, contact our team.
Know Which Features Are Really Capable
In thirty minutes we review your capability reports and data, and show Cpk and Ppk side by side for one part. You keep the analysis either way.
- 1A recent capability report
- 2Raw data for one characteristic
- 3Customer capability requirements
- 4Gauge study results
- 5One feature that keeps failing PPAP