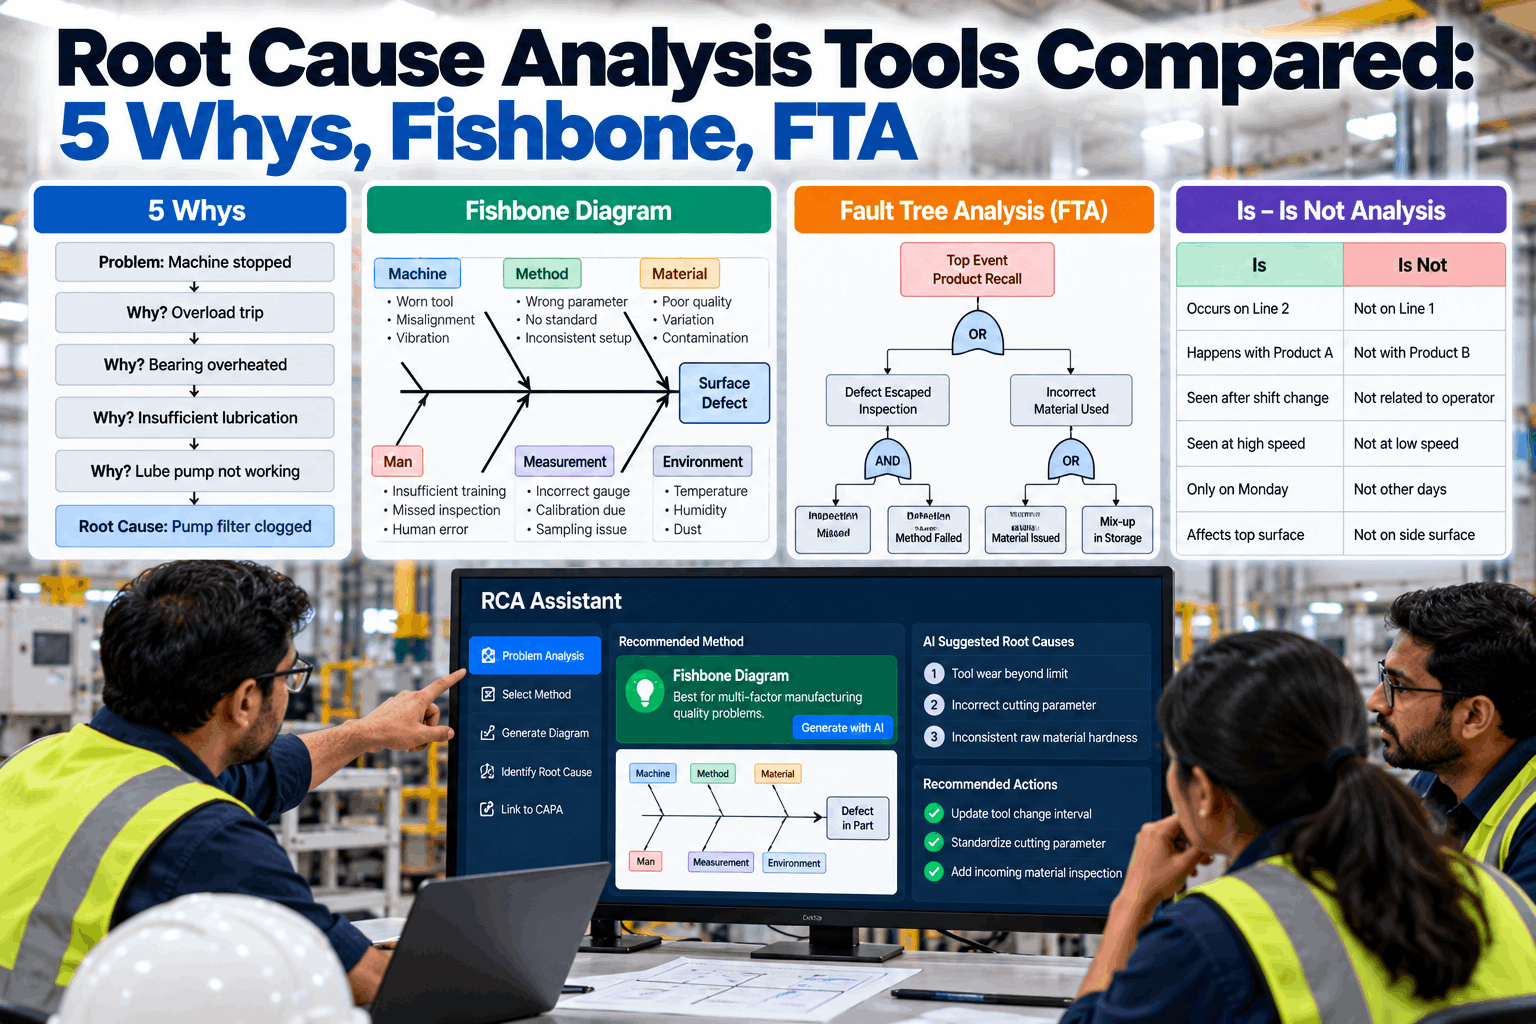
Every quality problem eventually prompts the same question: why did this happen? Which root cause analysis tool you choose decides how good the answer is. 5 Whys, fishbone, fault tree and is/is-not each work well on some problems and mislead on others. This guide compares them side by side with real manufacturing examples, and you can see AI choose the right method in a short live demo.
5 Whys, Fishbone, Fault Tree or Is/Is-Not: Pick the Right Tool for the Problem
Each RCA tool answers a different kind of question. iFactory's RCA Assistant chooses the method by problem type, drafts the diagram from your production data and links each verified cause to a corrective action.
Burrs appear on Machine 2 only, night shift only, since Tuesday. Comparing where the problem is and isn't narrows the cause fast.
What Each Tool Is Good At, and Where It Goes Wrong
These four methods aren't competitors. Each one fits a different shape of problem. 5 Whys follows a single chain. Fishbone maps many possible contributors. Fault tree analysis, developed at Bell Laboratories in 1962 for the Minuteman missile launch control system, models how failures combine. Is/is-not uses contrast to narrow down where the cause can be. Knowing the strengths and blind spots of each is what separates a quick, reliable investigation from a long one that ends in a guess. Our quality team can help you match them to your problem types.
Root Cause Analysis Tools Compared on Eight Criteria
The matrix below compares the four methods on the factors that matter when a quality engineer has to choose one under time pressure. No method wins on every row, and that is exactly why choosing well matters. The two rows that matter most are problem shape and bias risk. A tool that doesn't match the shape of the problem will produce a tidy answer that is wrong, and a tool with high bias risk will confirm whatever the team already believed. We can walk through this comparison against your recent NCRs in a working session.
A Four-Question Guide to Choosing the Method
Choosing the tool takes a few minutes and saves hours of analysis heading in the wrong direction. It also makes investigations consistent across shifts and sites, because two engineers facing the same problem will reach for the same method instead of whichever one they learned first. Ask these questions in order and use the first one that gets a clear yes. Many real investigations combine two methods, typically is/is-not or fishbone to narrow the field, then 5 Whys to follow the verified cause down. Our support team can help you build this into your NCR process.
How the Tools Work Together Inside 8D and CAPA
In most plants, root cause analysis doesn't stand alone. It is discipline 4 of an 8D or the investigation step of a CAPA. That framework sets the order around the tools: describe the problem precisely, contain it, find and verify the root cause, then correct and prevent. The tools do their best work when each is used for the part of the investigation it handles best, rather than one method being stretched across the whole job. If you'd like to standardize this sequence across sites, our quality specialists can show you how.
Pins down exactly what, where, when and how big the problem is. That sharpens the problem statement and often points straight at what changed.
Lays out every plausible contributor so the team doesn't lock onto the first idea. Each bone becomes a hypothesis to check against data.
Used when failures combine or safety is involved. It shows which combinations of events lead to the top event and where a barrier is missing.
Follows a verified cause down to the system gap behind it, such as a procedure, a design or an error-proofing gap, so the corrective action prevents recurrence.
Let the RCA Assistant Choose the Method and Draft the Diagram
iFactory reads the NCR, the process data and the defect history, recommends a method, drafts the fishbone, fault tree or is/is-not from real data, and keeps every cause linked to its verification and corrective action.
Each Method Applied to a Real Manufacturing Problem
Here is each tool on the kind of problem it suits. The examples are simplified so the logic stays visible, but they follow the structure a real investigation would use. Notice that each ends with a cause that can be checked against data, not an opinion. That is the test of whether the method has done its job. If the end of the analysis can't be verified, the investigation isn't finished, whichever tool was used. You can see AI drafts of each on your own data in a short demo.
- Why underfilled? Nozzle 4 was dispensing low.
- Why low? The nozzle was partly blocked with product residue.
- Why residue? It wasn't cleaned at the last changeover.
- Why not cleaned? The short-changeover SOP skips nozzle cleaning.
- Why does it skip it? The SOP was shortened last quarter with no risk review.
A Root Cause Isn't Proven Until It's Verified
Whichever tool you use, the output is a hypothesis until data confirms it. This is the step most often skipped under pressure to close an NCR, and it is the main reason the same defects come back. Strong RCA programs require a verification step, such as switching the cause on and off, matching it to the defect pattern or testing it, before a corrective action is approved. They then check that the action actually worked. Our quality team can help you make this chain mandatory in your workflow.
Stopping at "operator error" without asking why the system allowed it. Treating a fishbone brainstorm as the answer. Closing the NCR when the action is assigned rather than when its effect is confirmed. Using the same tool for every problem because it's familiar.
RCA Assistant, Data Connections and AI Server in One Package
The RCA Assistant works best when it can see production, quality and maintenance data together. iFactory delivers it as a turnkey bundle: a pre-configured NVIDIA AI server ships racked and ready with the software pre-loaded. You rack it, plug in power and Ethernet, and the AI is live. To scope it for your plant, request a turnkey quote.
- Pre-configured NVIDIA AI edge server, racked and ready
- Connectors for NCR, MES, SPC and maintenance data
- RCA templates for 5 Whys, fishbone, fault tree and is/is-not
- Cabling and plant network setup
- PLC/SCADA integration where process data is needed
- Quality team training on choosing methods
- 24×7 remote monitoring
Server installed, NCR and process history connected, defect codes mapped.
The assistant drafts RCAs on live NCRs alongside your engineers' own analyses.
Verification and effectiveness steps made mandatory, and teams trained.
An RCA Assistant That Picks the Method and Proves the Cause
iFactory's RCA Assistant brings method choice, diagram drafting and corrective action tracking into one flow. Our support team can review your current RCA process with you.
What Quality Teams Ask About RCA Tools
Choose the Right RCA Tool Every Time
Let the assistant recommend the method, draft the analysis from real data and keep every verified cause tied to a corrective action that is checked for effect. The full system is delivered turnkey and goes live in 6 to 12 weeks.