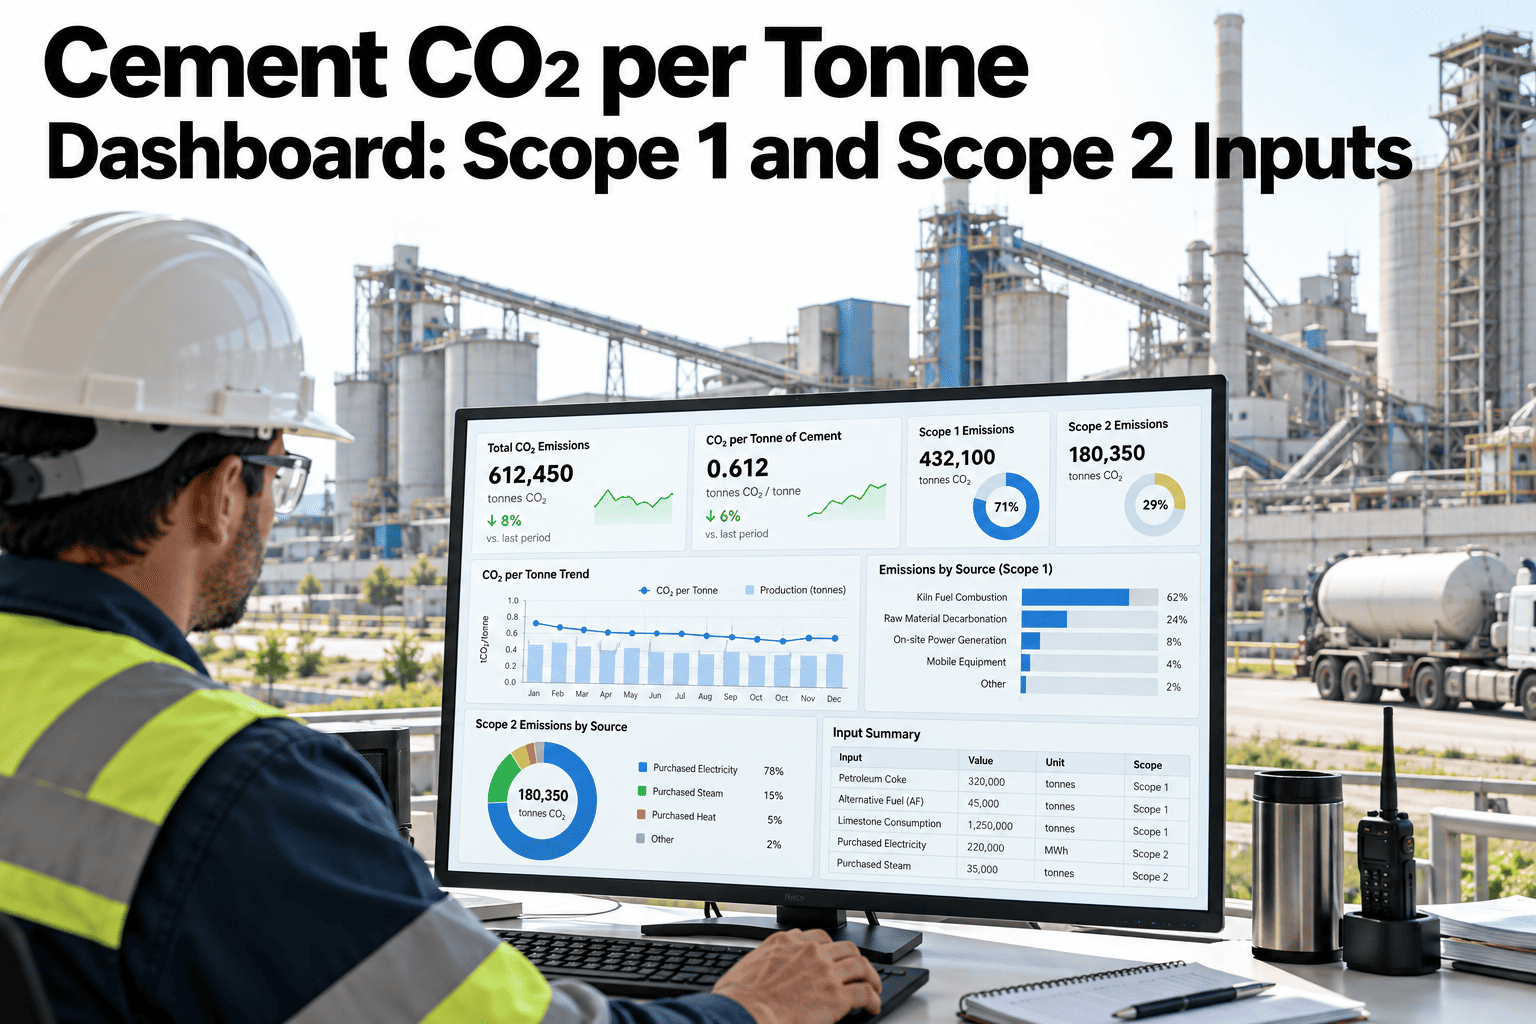
A cement plant's CO2 per tonne figure is really two separate calculations wearing one number: Scope 1 emissions from fuel combustion and the calcination process inside the kiln, and Scope 2 emissions from purchased electricity running the mills, fans and other equipment. Blending both into a single dashboard figure without showing the split hides which lever actually moves the number, fuel mix and kiln efficiency on one side, grid electricity and purchased power source on the other. A dashboard that keeps Scope 1 and Scope 2 visible separately, with a clear calculation boundary and output denominator behind each, gives a plant team something they can actually act on rather than just report. Teams reviewing their current CO2 per tonne view can see Scope 1 and Scope 2 broken out on a live per-tonne dashboard before the next reporting cycle.
Cement CO2 per Tonne Dashboard: Scope 1 and Scope 2 Inputs
Scope 1 and Scope 2 kept separate, with a clear calculation boundary and output denominator behind each.
Why Blending Scope 1 and Scope 2 Hides the Lever
One combined number makes it hard to tell which part of the operation to act on.
A rising per-tonne figure could come from fuel mix, kiln efficiency, or grid power, with no way to tell which.
Scope 1 responds to fuel and kiln decisions; Scope 2 responds to power sourcing decisions.
A blended number is hard to use for planning a specific improvement investment.
Keeping the two visible separately is what turns a reporting number into an operational signal.
Calculation Boundary and Fuel Combustion
The boundary defines what counts, and fuel combustion data is the main Scope 1 input for most plants.
Calculation Boundary
Which kilns, lines and processes are included, defined consistently across reporting periods.
Fuel Combustion
Conventional and alternative fuel consumption, by type, feeding the Scope 1 calculation.
See Your Own Scope 1 and Scope 2 Split Live
Book a 30-minute session and bring your fuel and electricity data. iFactory AI will show the split dashboard on your own numbers.
Purchased Electricity and the Output Denominator
Scope 2 inputs and the production denominator together determine the final per-tonne figure.
| Input | Source | Role in Calculation |
|---|---|---|
| Purchased electricity | Utility billing and meter data | Drives Scope 2 emissions via grid factor |
| Output denominator | Production records by product type | Converts total emissions into per-tonne figure |
Factor Management and Audit Trail
The final piece is keeping the calculation consistent and explainable over time.
Factor Management
Grid and fuel emission factors are version-controlled rather than hardcoded into a spreadsheet.
Audit Trail
Every per-tonne figure traces back to its source fuel, electricity and production records.
iFactory AI connects fuel, electricity and production data into a Scope 1 and Scope 2 dashboard. Scope covers data integration, boundary setup and validation.
Expert Review
The split between Scope 1 and Scope 2 matters most when a plant is deciding where to invest. A rising per-tonne figure driven by grid electricity points toward a power sourcing conversation, while one driven by fuel mix points toward kiln and alternative fuel decisions. A blended number cannot direct either conversation.
Output denominator choices deserve more scrutiny than they typically get. Using the wrong production basis, clinker versus cement for example, can shift the reported per-tonne figure meaningfully even when the underlying emissions have not changed.
Frequently Asked Questions
Should the denominator be clinker or cement production?
This depends on the reporting purpose, since a clinker-based denominator isolates kiln performance while a cement-based denominator reflects the final product mix including blended cements. Many plants report both. Discuss which denominator fits your reporting need in a working session.
How often should grid emission factors be updated?
Grid factors are typically updated annually as published by the relevant authority, and the dashboard should reference the correct factor version for each reporting period rather than one fixed value applied indefinitely. Ask support about your grid factor source.
Does this calculation align with GHG Protocol methodology?
The boundary, scope definitions and factor management follow GHG Protocol-aligned methodology, though specific regulatory submissions may require additional framework-specific adjustments. Request a methodology walkthrough.
Can the dashboard show trends over multiple years?
Yes, historical per-tonne figures can be tracked alongside current data, letting a plant see whether Scope 1 or Scope 2 intensity is trending up or down over time. Contact support about loading historical data.
How long before the dashboard reflects our own plant's boundary accurately?
Most plants have a validated dashboard within six to nine weeks, depending on how many data sources need connecting and how the boundary is defined across kilns and lines. Book a session to estimate your own timeline.
See Which Lever Is Actually Moving Your CO2 per Tonne
iFactory AI keeps Scope 1 and Scope 2 visible separately on one live dashboard. See it on your own plant data.