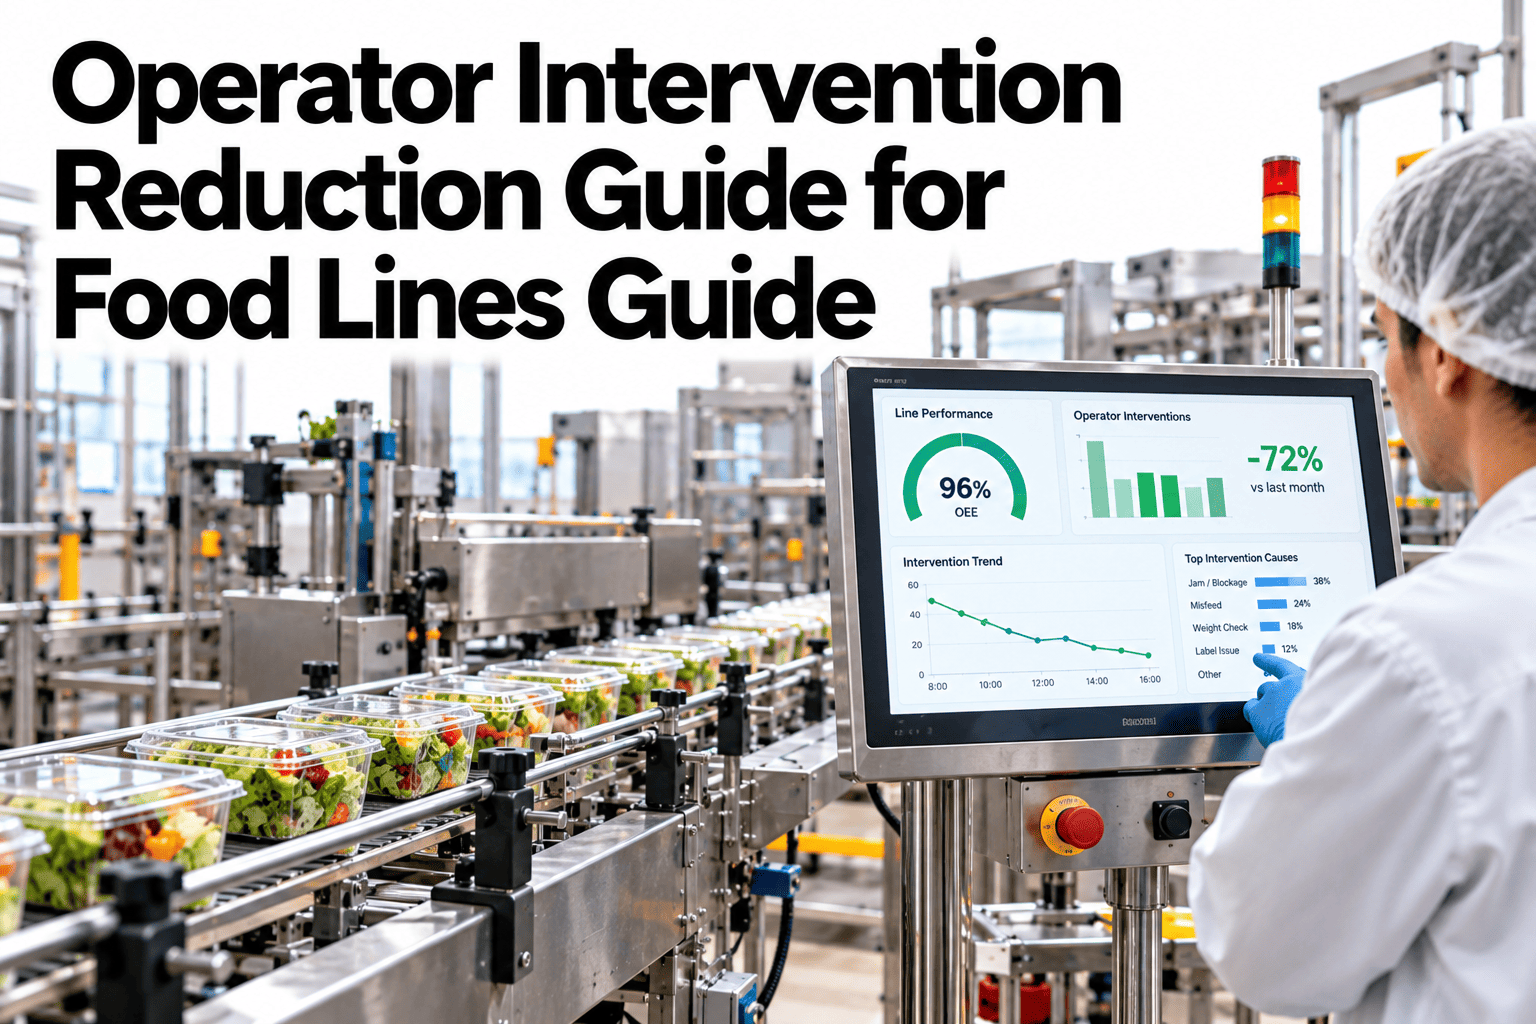
Every time an operator clears a jam, resets a fault or nudges a guide, the line pays twice: once in lost output and once in lost attention. Operator interventions are micro-stops with a person attached, and on many food lines they happen far more often than anyone has counted. Reducing them frees operators for quality and improvement work while steadying output. This guide shows how to count interventions, find the causes and tune machines to need fewer hands. To plan an intervention audit, you can review an intervention study with our team.
Micro-stop and changeover losses
Cut the Number of Times Operators Have to Step In to Keep the Line Running
iFactory AI counts interventions by machine and cause, so teams can fix the repeat problems that keep operators tied to the line.
Why does the cartoner need a hand every few minutes?
Intervention insight
142 interventions this shift. Most were jam clears at the infeed, mainly after product changes. Guide setting is the likely cause.
Source: machine signalsFocus: infeed
What countsAn Intervention Is Any Time a Person Must Step In
Clearing a jam, resetting an alarm, refilling film or making a quick adjustment all count. Each one interrupts both the machine and the operator.
Machine hesitates
A sensor, jam or fault appears
Operator steps in
Walks over and assesses
Fix is applied
Clears, resets or adjusts
Line restarts
Often at reduced speed
Most interventions take seconds, which is why they escape normal stop reporting. Their total effect is large.
Five typesThe Interventions Behind Most Lost Hands-On Time
1
Jam clears
Product or packaging stuck at an infeed, chute or sealer.
2
Fault resets
Alarms from sensors, drives or safety circuits that need a reset.
3
Consumable refills
Film, labels, glue, cartons or lids running out.
4
Adjustments
Small changes to guides, speeds or settings.
5
Quality checks
Stopping to inspect or remove suspect product.
How to countFour Ways to Measure Interventions
1
Machine signals
Detect stops, resets and restarts automatically.
2
Operator inputs
Use a quick button or tablet tap to tag the cause.
3
Observation
Watch a line for a few hours to calibrate.
4
Review
Compare counts across machines, shifts and products.
Automatic signals give the count. A quick tag, or a short observation, gives the cause.
Count the Interventions Your Line Really Needs
Share a few days of stop data and see how iFactory AI would count and classify operator interventions by machine and cause.
Causes and fixesMatch the Intervention Type to the Machine Fix
| Intervention | Common cause | Machine or process fix |
|---|
| Infeed jam | Guide settings or product variation | Set guides to standard, tune the feeder and check product size |
| Sensor fault reset | Dirty or misaligned sensor | Clean and realign, then add to routine checks |
| Film or label run out | No early warning | Add a low-level warning and a standard refill time |
| Frequent adjustment | No standard settings | Create recipe sheets for each product |
| Rejected product removal | Upstream variation | Fix the source of the variation |
What drives the countAn Illustrative Split of Interventions on One Line
The mix differs by line. This example shows how to read it.
40 percent: Jam clears
Mostly at infeeds and transfers.
25 percent: Fault resets
Sensors, drives and interlocks.
20 percent: Refills
Film, labels and cartons.
15 percent: Adjustments
Small corrections to settings.
Fix the biggest slice first. Jam clears alone often account for a large share of hands-on time.
Operator workloadThree Tiers of Hands-On Load
Light
Operators step in a few times per hour and have time for quality work.
Heavy
Operators step in every few minutes and focus only on the line.
Overloaded
Interventions are so frequent that other tasks are skipped.
Track interventions per hour per operator. A falling number is a sign of better machine health and steadier output.
Voices from the floorOperators Know Where the Problems Are
Operator
I know which guide sticks, but nobody asked me.
Technician
I fix the same sensor every week.
Supervisor
We do not know how often it really happens.
Quality lead
Interventions hide product that was almost rejected.
Involve operators in the audit. Their knowledge speeds up root cause work.
Before and afterWhat Fewer Interventions Look Like
Track the same measures before and after tuning. This view is illustrative.
Some plants report reductions of around forty percent after systematic tuning, but results vary by line and starting condition.
The auditFour Weeks to Find and Fix the Top Causes
1
Week 1
Count interventions automatically and tag causes.
2
Week 2
Rank by machine, cause and shift.
3
Week 3
Fix the top three causes with operators and technicians.
4
Week 4
Re-count and compare with week one.
5
Ongoing
Review monthly and move to the next causes.
Machine signals capture every stop and restart
Operators can tag a cause in seconds
Interventions ranked by machine and cause
Top three causes assigned to owners
Standard settings written for each product
Sensor and guide checks added to routines
Interventions per hour tracked weekly
Results shared with the line team
Expert reviewWhat a Production Excellence Lead Would Check First
Expert review
Intervention counts become powerful when they lead to specific fixes. The strongest programmes pair counting with a short list of owned actions and weekly review.
VerdictStrong when counts are automatic and causes are tagged with operators.
Watch forTreating interventions as an operator skill problem rather than a machine problem.
Do nextCount one line for two weeks and fix the single biggest cause.
Frequently asked questionsWhat Food Line Teams Ask About Operator Interventions
Why measure interventions as well as stops?
Many interventions are too short to appear in stop reports, but they add up and tie operators to the line. Counting them reveals repeat problems and shows how much hands-on time machines demand.
See an intervention count example.
Can we count interventions without new sensors?
Often yes. Stops, resets and restarts can be detected from existing machine signals, and a quick tag from the operator adds the cause. Short observation periods help check the results.
Ask about using existing signals.
Will tracking interventions feel like surveillance?
It helps to be clear that the goal is to fix machines, not to judge people. Share results openly, involve operators in choosing fixes and recognise improvements they suggest.
Plan communication with operators.
What reduction is realistic?
Some plants report reductions of around forty percent after tuning and fixing the top causes, but the figure depends on starting condition, machine age and product variation. Measure a baseline before promising a number.
Ask about baselines.
Where should we start?
Start with the line or machine that needs the most hands-on attention. Count for two weeks, rank the causes and fix the top three before spreading the method.
Choose a pilot line.
Fewer hands, steadier output
Free Your Operators From Repeat Fixes
Book a session with iFactory AI to count interventions on your busiest line, rank the causes and plan the first machine fixes.